
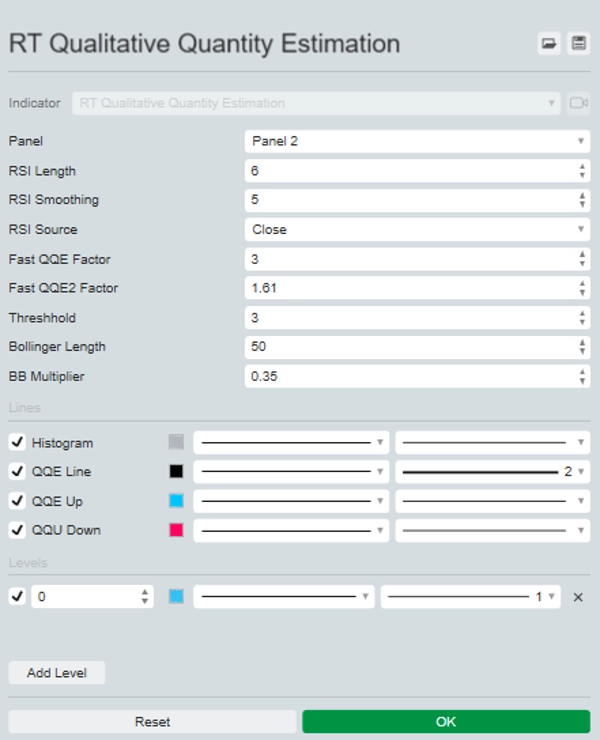
RT Qualitative Quantity Estimation
Indicatore
1 acquisti
Versione 1.0, Sep 2024
Windows, Mac
Descrizione
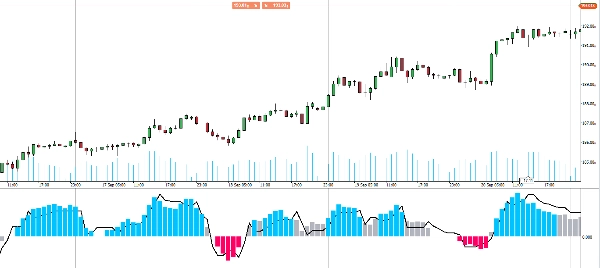
Presentiamo l'avanzato indicatore QQE (Qualitative Quantitative Estimation), uno strumento potente che combina due indicatori QQE per approfondimenti di trading migliorati.
Un QQE è visualizzato sul grafico come colonne, mentre l'altro opera in background con una Banda di Bollinger a 50 periodi che funge da linea zero.
Questa configurazione ti consente di valutare visivamente il momentum del mercato e identificare con chiarezza i potenziali punti di ingresso. Quando entrambi gli indicatori QQE sono allineati, vedrai barre blu o rosse chiare, che segnalano forti opportunità di acquisto o vendita.
Eleva la tua strategia di trading con l'indicatore QQE per decisioni più informate e una maggiore precisione nella tua analisi di mercato.
Riepilogo
Profilo indicatore
Recensioni dei clienti
0.0
Recensioni: 0
Recensioni dei clienti
Questo prodotto non ha ancora ricevuto recensioni. L'hai già provato? Fallo sapere agli altri per primo!
Discussioni
Domande frequenti
BTCUSD
Forex
Signal
Indices
EURUSD
Commodities
GBPUSD
NZDUSD
Crypto
Stocks
XAUUSD
NAS100
USDJPY
I prodotti disponibili tramite cTrader Store, inclusi bot di trading, indicatori e plugin, sono forniti da sviluppatori terzi e resi disponibili esclusivamente a scopo informativo e di accesso tecnico. cTrader Store non è un broker e non fornisce consulenze in materia di investimento, raccomandazioni individualizzate o garanzie di risultati futuri.


Prezzo
Da 25/09/2024
20
Vendite