
Renko Reversal
อินดิเคเตอร์
14 การซื้อ
เวอร์ชัน 1.2, Apr 2026
Windows, Mac
4.3
รีวิว: 3
คำอธิบาย
ปลดล็อกจุดเข้าเทรดคุณภาพสูงด้วยตัวบ่งชี้ Renko Reversal สำหรับ cTrader
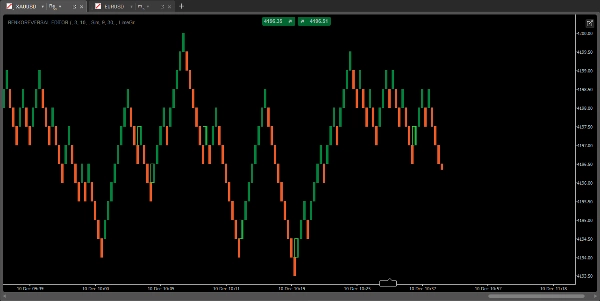
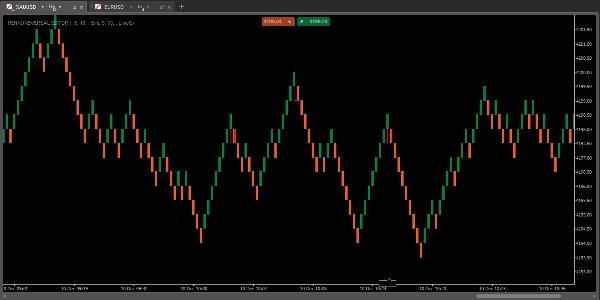
ตัวRenko Reversal Indicator คือเครื่องมือที่ดีที่สุดของคุณสำหรับการจับการต่อเนื่องของแนวโน้ม อย่างแม่นยำบนกราฟ Renko ออกแบบมาเพื่อตัดเสียงรบกวนและมุ่งเน้นเฉพาะโอกาสที่แข็งแกร่งที่สุด ตัวบ่งชี้นี้ไปไกลกว่าการเปลี่ยนสีบล็อกธรรมดา
วิธีที่ช่วยให้คุณได้เปรียบ (ตัวกรองพิเศษ):
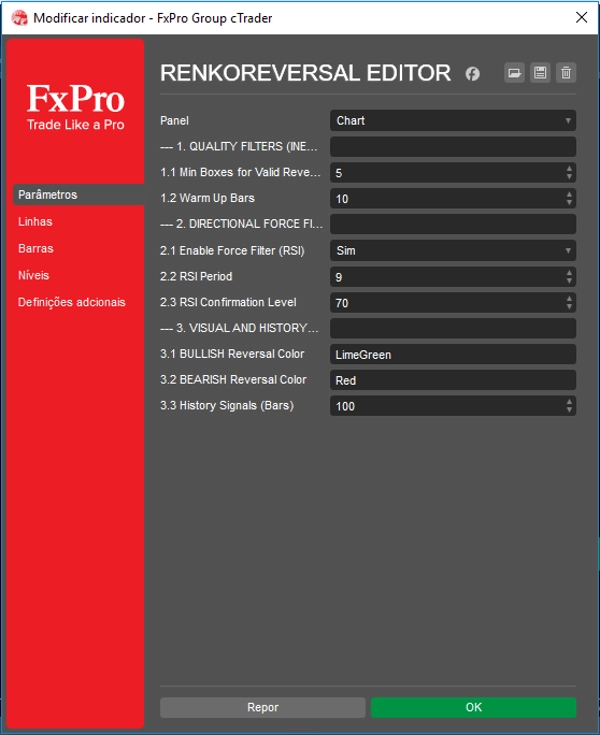
- ตัวกรองแรงเฉื่อย: หยุดเทรดจุดกลับตัวที่อ่อนแอ! เราต้องการแรงเฉื่อยของกล่องขั้นต่ำ ในช่วงการแก้ไข ตัวบ่งชี้จะแจ้งเตือนเฉพาะเมื่อการย้อนกลับลึกพอ ซึ่งเป็นการยืนยันความแข็งแกร่งของการกลับตัว
- ตัวกรองแรงขับเคลื่อนทิศทาง (RSI): สัญญาณได้รับการยืนยันสองชั้นโดยโมเมนตัม การต่อเนื่องจะได้รับการยืนยันเฉพาะถ้าRSI แสดงว่าแรงขับเคลื่อนอยู่ในเขตทิศทางใหม่ (เหนือ/ต่ำกว่าระดับ 50) เพื่อให้แน่ใจว่าคุณเข้าสู่ตลาดอย่างแม่นยำเมื่อโมเมนตัมใหม่เริ่มต้น
เทรดด้วยความมั่นใจ:
มุ่งเน้นที่การเปลี่ยนแปลงโมเมนตัมที่ชัดเจนและเข้าสู่ตลาดด้วยความมั่นใจมากขึ้น ด้วยพารามิเตอร์ที่ปรับได้อย่างเต็มที่ (แรงเฉื่อย, ช่วง RSI และระดับ) คุณสามารถปรับความไวให้เหมาะกับคู่เงินหรือสไตล์การเทรดใดก็ได้
ติดตั้งวันนี้และเปลี่ยนวิธีการเทรดการต่อเนื่องของแนวโน้มของคุณ
สรุป
สรุปโดย AI
The Renko Reversal Indicator for cTrader is designed to identify potential trend reversal points on Renko charts by analyzing price changes and the average True Range (ATR). It visually signals possible reversals by changing the color of Renko blocks. The indicator incorporates two key filters to enhance signal quality: an Inertia Filter that requires a minimum box inertia during corrections to confirm strong reversals, and a Directional Force Filter using RSI to validate momentum shifts, signaling entries only when RSI crosses the midpoint level 50 in the new trend direction. Parameters such as Inertia, RSI period, and RSI level are fully adjustable, allowing customization for different trading styles and instruments. This indicator supports various markets including Forex, cryptocurrencies, commodities, indices, and stocks, with tags referencing symbols like BTCUSD, EURUSD, GBPUSD, XAUUSD, NAS100, and USDJPY. It is intended to assist traders in capturing trend continuations with higher precision by focusing on clean momentum shifts on Renko charts.
โปรไฟล์อินดิเคเตอร์
รีวิวจากลูกค้า
4.3
รีวิว: 3
5 | 33 % | |
4 | 67 % | |
3 | 0 % | |
2 | 0 % | |
1 | 0 % |
รีวิวจากลูกค้า
March 2, 2025
Useful if not rushed for traders who like filtered price action. It gives value around Renko chart setups, but brick charts can hide useful detail. A fair Renko test needs 25 signals, 1R exits and a check for late reversal bricks. The chart looks cleaner, but it still needs normal price context.
March 1, 2025
March 1, 2025
Clear trading aid for Renko chart setups. it cuts down candle noise and makes direction easier to read, especially when used for filtering price movement into cleaner swings. I would check 10 to 15 bricks before trusting the direction and confirm it on normal candles. The chart looks cleaner, but it still needs normal price context.
การสนทนา
คำถามที่พบบ่อย
BTCUSD
Forex
Signal
Breakout
Indices
EURUSD
Commodities
GBPUSD
NZDUSD
Prop
ZigZag
Scalping
Crypto
Stocks
XAUUSD
NAS100
USDJPY
ผลิตภัณฑ์ที่มีให้บริการผ่าน cTrader Store รวมถึงบอทการเทรด อินดิเคเตอร์ และปลั๊กอิน มีให้บริการโดยนักพัฒนาบุคคลที่สามและมีไว้เพื่อวัตถุประสงค์ในการเข้าถึงข้อมูลและทางเทคนิคเท่านั้น cTrader Store ไม่ใช่โบรกเกอร์และไม่ได้ให้คำแนะนำการลงทุน คำแนะนำส่วนบุคคล หรือการรับประกันผลการดำเนินงานในอนาคต


!["[Hamster-Coder] Pivot Points MTF" โลโก้](https://cdn.ctrader.com/image/webp/4c143e5a-309c-40e3-a578-f04d1e133ffa_31159)


ราคา
ตั้งแต่ 05/02/2025
31
การขาย