
ADXMultiframeIndicator
อินดิเคเตอร์
1 การซื้อ
เวอร์ชัน 1.0, Oct 2025
Windows, Mac
5.0
รีวิว: 2
คำอธิบาย
The Multi-Timeframe ADX Trend Dots & Arrows เป็นตัวบ่งชี้การซื้อขายระดับมืออาชีพสำหรับ cTrader ออกแบบมาเพื่อระบุแนวโน้มตลาดที่สอดคล้องกันในหลายกรอบเวลาโดยใช้ Average Directional Movement Index (ADX).
🔹 คุณสมบัติหลัก:
- ✅ วิเคราะห์ได้สูงสุดถึง 4 กรอบเวลาที่ปรับแต่งได้ (M15, H1, H4, Daily).
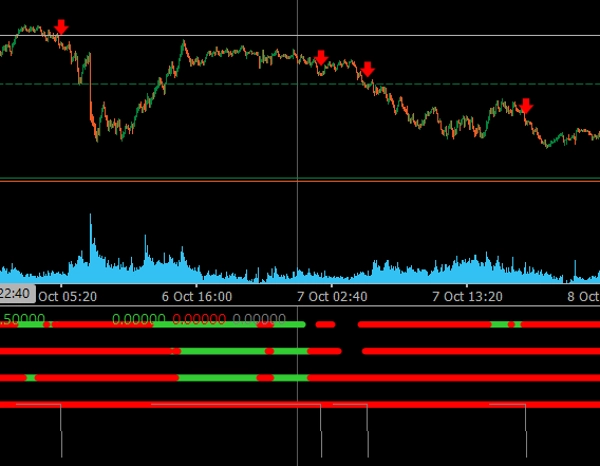
- ✅ จุดสีแสดงทิศทางแนวโน้ม (สีเขียว = แนวโน้มขาขึ้น, สีแดง = แนวโน้มขาลง).
- ✅ ลูกศรอัตโนมัติปรากฏเมื่อกรอบเวลาทั้งหมดสอดคล้องกันในทิศทางเดียวกัน.
- ✅ ตัวกรองแท่งต่อเนื่อง ช่วยลดสัญญาณเท็จหรือสัญญาณที่ออกก่อนเวลา.
- ✅ การแสดงผลที่สะอาดและทันสมัย เหมาะสำหรับธีมกราฟทั้งแบบมืดและสว่าง.
- ✅ เหมาะอย่างยิ่งสำหรับการตรวจจับการยืนยันหลายกรอบเวลาและจุดต่อเนื่องของแนวโน้ม.
ตัวบ่งชี้นี้เหมาะสำหรับเทรดเดอร์ที่ต้องการ เห็นภาพรวมที่ใหญ่ขึ้น และ เข้าเทรดเฉพาะเมื่อกรอบเวลาทั้งหมดเห็นพ้องต้องกัน ซึ่งช่วยให้ได้การตั้งค่าการเทรดที่แข็งแกร่งและน่าเชื่อถือมากขึ้น.
สรุป
สรุปโดย AI
The ADXMultiframeIndicator is a trading indicator for the cTrader platform that identifies market trends by analyzing the Average Directional Movement Index (ADX) across multiple timeframes. It supports up to four customizable timeframes, including M15, H1, H4, and Daily. The indicator displays colored dots to indicate directional bias—green for uptrends and red for downtrends—and automatically shows arrows when all selected timeframes align in the same direction. A consecutive bars filter is included to reduce false or premature signals. The visualization is designed to be clear and modern, compatible with both dark and light chart themes. This tool assists traders in confirming multi-timeframe trends and identifying trend continuation points by highlighting when all timeframes agree, facilitating more informed trade entries. It is particularly useful for analyzing indices markets.
โปรไฟล์อินดิเคเตอร์
รีวิวจากลูกค้า
5.0
รีวิว: 2
5 | 100 % | |
4 | 0 % | |
3 | 0 % | |
2 | 0 % | |
1 | 0 % |
รีวิวจากลูกค้า
October 28, 2025
the first signal should not decide the only input, but it can look better than it is during a lucky run.
การสนทนา
คำถามที่พบบ่อย
Indices
ผลิตภัณฑ์ที่มีให้บริการผ่าน cTrader Store รวมถึงบอทการเทรด อินดิเคเตอร์ และปลั๊กอิน มีให้บริการโดยนักพัฒนาบุคคลที่สามและมีไว้เพื่อวัตถุประสงค์ในการเข้าถึงข้อมูลและทางเทคนิคเท่านั้น cTrader Store ไม่ใช่โบรกเกอร์และไม่ได้ให้คำแนะนำการลงทุน คำแนะนำส่วนบุคคล หรือการรับประกันผลการดำเนินงานในอนาคต
เพิ่มเติมจากผู้เขียนคนนี้


!["[Hamster-Coder] Bollinger Bands" โลโก้](https://cdn.ctrader.com/image/webp/21d8e5d6-fb11-4bac-b9ee-cd05c2b76804_30327)


ราคา
ตั้งแต่ 21/01/2025
3
การขาย