
Opis
ZigZag Pro – wskaźnik wieloswingowy dla cTrader
Opis:
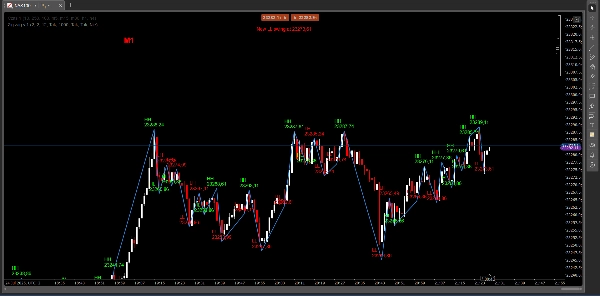
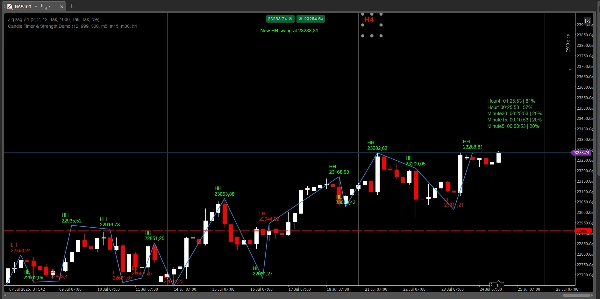
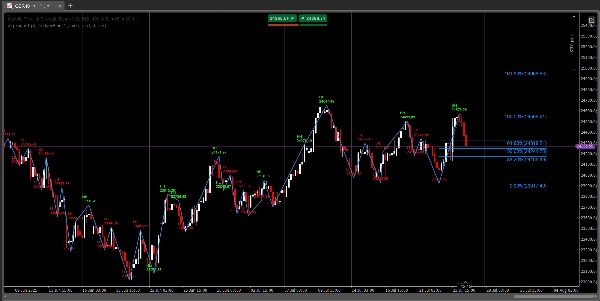
ZigZag Pro to potężny i w pełni konfigurowalny wskaźnik swingowy dla cTrader.
Automatycznie wykrywa i oznacza wszystkie główne punkty swingowe (HH, HL, LH, LL) na Twoim wykresie, rysuje wyraźne linie ZigZag oraz zapewnia alerty w czasie rzeczywistym (dźwiękowe i wizualne) dla nowych zdarzeń swingowych.
Idealny dla traderów price action, swing traderów oraz wszystkich, którzy chcą zobaczyć strukturę rynku na pierwszy rzut oka.
Kluczowe cechy:
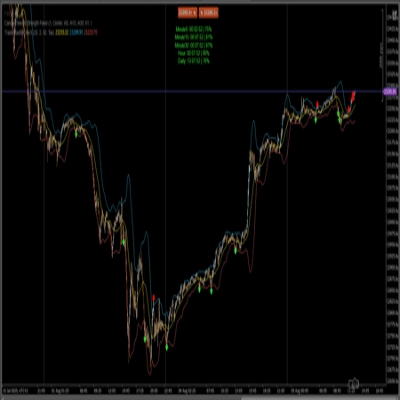
- Automatyczne wykrywanie swingów:
-
- Identyfikuje i oznacza wszystkie lokalne maksima i minima jako HH (Higher High), HL (Higher Low), LH (Lower High), LL (Lower Low).
- Czułość (liczba świec) jest w pełni regulowana.
- Konfigurowalne linie ZigZag:
-
- Zmień kolor i grubość linii ZigZag.
- Wybierz ulubione kolory dla oznaczeń byczych (HH/HL) i niedźwiedzich (LH/LL).
- Inteligentne etykiety:
-
- Pokaż lub ukryj cenę na każdej etykiecie.
- Ustaw rozmiar czcionki etykiety dla idealnej czytelności.
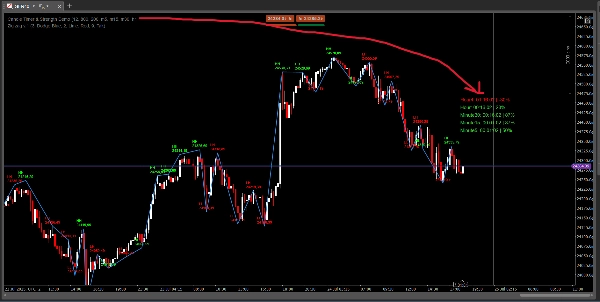
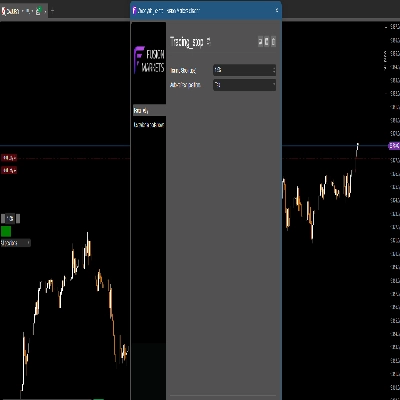
- Alerty w czasie rzeczywistym:
-
- Alert dźwiękowy (np. dzwonek do drzwi) i/lub alert wizualny (duży tekst na wykresie) gdy pojawi się nowy swing HH lub LL.
- Alerty można włączać/wyłączać niezależnie.
- Eksport swingów do CSV:
-
- Zapisz wszystkie wykryte swingi (indeks, czas, typ, cena) do pliku CSV do dalszej analizy lub prowadzenia dziennika.
- Wydajność:
-
- Analizuje do 2000 świec wstecz dla głębokiej struktury rynku.
- Szybki i lekki – działa na każdym instrumencie i interwale czasowym.
Jak to działa:
- Wskaźnik skanuje wykres w poszukiwaniu lokalnych maksimów i minimów na podstawie wybranej czułości.
- Każdy swing jest oznaczany jako HH, HL, LH lub LL i łączony linią ZigZag.
- Gdy pojawi się nowy HH lub LL, otrzymujesz natychmiastowy alert dźwiękowy i/lub wizualny (jeśli włączony).
- Wszystkie swingi można wyeksportować do pliku CSV dla Twojej dokumentacji.
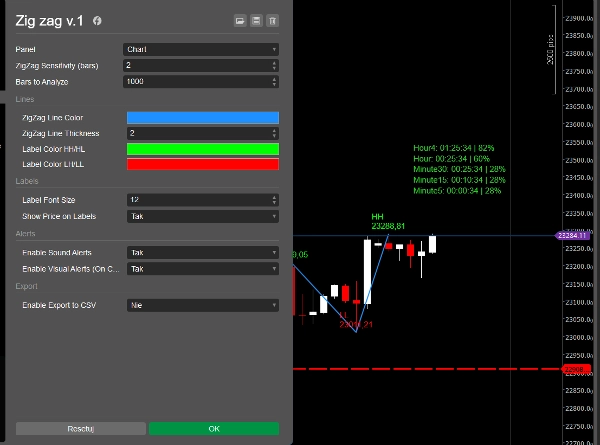
Parametry:
- Czułość ZigZag (świece)
- Kolor i grubość linii ZigZag
- Kolor etykiet HH/HL, kolor etykiet LH/LL
- Rozmiar czcionki etykiet
- Pokaż cenę na etykietach (tak/nie)
- Liczba świec do analizy
- Włącz alerty dźwiękowe (tak/nie)
- Włącz alerty wizualne (tak/nie)
- Włącz eksport do CSV (tak/nie)
Dlaczego warto wybrać ZigZag Pro?
- Zobacz strukturę rynku natychmiast – koniec zgadywania, gdzie zmienia się trend.
- Nigdy nie przegap nowego swingu – otrzymuj powiadomienia na żywo.
- Idealny dla strategii price action, SMC, ICT i swing tradingu.
- Łatwy w użyciu, w pełni konfigurowalny i profesjonalny wygląd.
Wypróbuj ZigZag Pro i przenieś swój swing trading na wyższy poziom!
Zobacz wszystkie moje wskaźniki i boty:
https://ctrader.com/pl?search=kobud.222&u=kobud.222
http://www.youtube.com/@Robi22-22
📩 Pytania? Sugestie? Rabat?
Kontakt dostępny w moim profilu: Robikobud
https://youtu.be/tYmNR7uel84
Podsumowanie
The indicator provides real-time alerts via sound and/or visual notifications when new significant swings occur, which can be enabled or disabled independently. It supports exporting all detected swings (index, time, type, price) to CSV files for further analysis or record-keeping. ZigZag Pro analyzes up to 2000 bars historically, offering a fast and lightweight tool suitable for any instrument and timeframe.
Ideal for price action, swing, and market structure trading strategies, ZigZag Pro helps traders visualize market trends and structure instantly, enhancing decision-making without manual chart analysis. Key adjustable parameters include sensitivity, colors, label settings, alert preferences, and export options.
Opinie klientów
5 | 0 % | |
4 | 100 % | |
3 | 0 % | |
2 | 0 % | |
1 | 0 % |


![Logo „[Stellar Strategies] Inside Bar with Signals”](https://cdn.ctrader.com/image/webp/1d9e8bfa-3b2c-4440-bb37-5856902008a7_30683)


