
Descrição
🟢 Indicador Smooth Heiken Ashi para cTrader
Negocie com clareza. Siga a tendência com confiança.
O indicador Smooth Heiken Ashi é uma ferramenta de gráfico refinada projetada para filtrar o ruído do mercado e destacar o verdadeiro momentum do preço. Desenvolvido para a plataforma cTrader, este indicador combina os tradicionais candles Heiken Ashi com um algoritmo de suavização para fornecer sinais de tendência mais limpos e confiáveis.
🔍 Principais Características
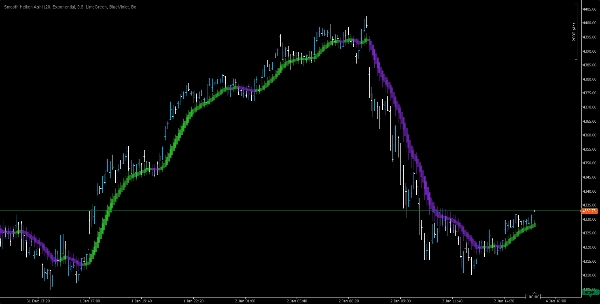
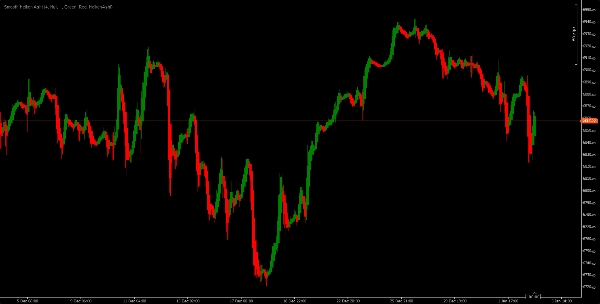
• Candles Heiken Ashi Suavizados
Reduza sinais falsos e ações de preço instáveis com candles visualmente aprimorados que enfatizam a direção da tendência.
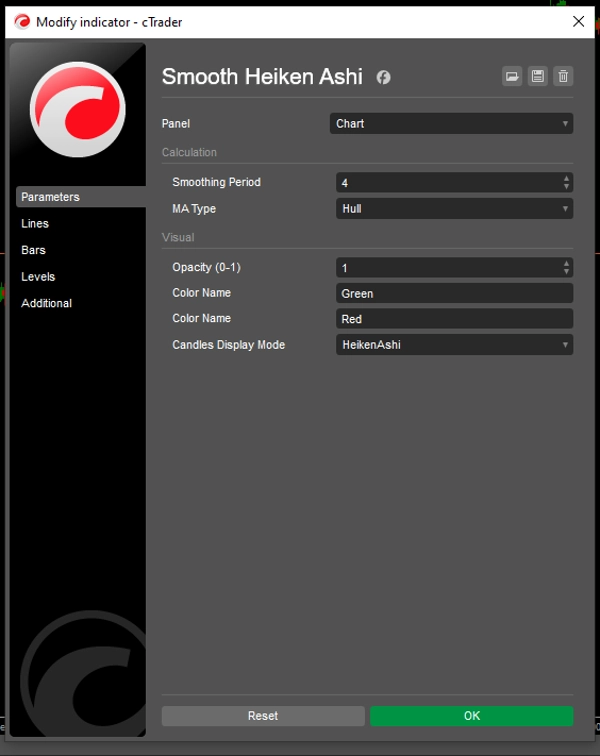
• Opções de Suavização Personalizáveis
Ajuste o fator de suavização para combinar com seu estilo de negociação—seja scalping ou swing trading.
• Linha de Sobreposição de Tendência
Uma curva dinâmica sobrepõe os candles para reforçar a força da tendência e potenciais reversões.
• Visuais Limpos
Gradientes de cor elegantes e design minimalista tornam seus gráficos mais fáceis de ler e interpretar.
📈 Ideal Para
• Estratégias de seguimento de tendência
• Confirmação de momentum
• Filtragem de ruído do mercado
• Traders visuais que buscam clareza e precisão
Smooth Heiken Ashi ajuda você a manter o foco no que importa—direção do preço, não distrações. Seja construindo um sistema algorítmico ou negociando manualmente, este indicador adiciona uma camada de confiança à sua análise.
Resumo
Avaliações de clientes
5 | 100 % | |
4 | 0 % | |
3 | 0 % | |
2 | 0 % | |
1 | 0 % |


