
KaufmanEfficiencyRatio
Indicador
78 transferências
Versão 1.0, Sep 2025
Windows, Mac
Descrição
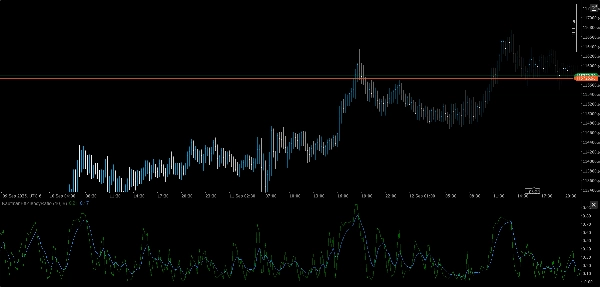
⚡ Índice de Eficiência de Kaufman (KER)
Clareza de tendência, quantificada.
O Índice de Eficiência de Kaufman (KER) é uma ferramenta precisa para medir quão eficientemente o preço se move do ponto A ao B—sem se perder no ruído. Seja para validar condições de rompimento ou filtrar movimentos laterais, o KER fornece uma pontuação limpa entre 0 e 1 que reflete a intenção direcional em relação à volatilidade.
🔍 O que ele faz
- Calcula o Índice de Eficiência de Kaufman:
- Fornece um valor normalizado de 0 (ruído puro) a 1 (tendência perfeita)
- Destaque para regimes de tendência versus não tendência sem ambiguidade
- Ideal para sobreposições adaptativas, filtros de regime e controle de sinais
🛠️ Principais Características
- Gerenciador de entrada modular para múltiplos períodos de tempo
- Compatível com múltiplos ativos: FX, cripto, índices, ações
- Lógica leve e em tempo real sem atraso de suavização
- Plug-and-play com sua arquitetura de suíte existente
🎯 Casos de Uso
- Validação de Tendência: Confirme o viés direcional antes da execução do sinal
- Filtragem de Ruído: Suprima entradas durante ações de preço ineficientes
- Detecção de Regime: Combine com sobreposições sensíveis à volatilidade para transições mais inteligentes
- Construção de Estratégia: Use como métrica central em lógica de rompimento, momentum ou viés
💡 Bônus
KER é gratuito, rápido e implacavelmente eficiente—assim como seu código. Sem enrolação, sem filtros. Apenas a intenção pura do mercado, destilada.
Resumo
Perfil do indicador
Avaliações de clientes
0.0
Avaliações: 0
Avaliações de clientes
Ainda não há avaliações para este produto. Já o experimentou? Seja o primeiro a contar a outras pessoas!
Conversa
Perguntas frequentes
Breakout
Scalping
AI
Os produtos disponíveis através da cTrader Store, incluindo bots de negociação, indicadores e plugins, são fornecidos por programadores terceiros e são disponibilizados apenas para fins informativos e de acesso técnico. A cTrader Store não é um corretor e não fornece aconselhamento em matéria de investimento, recomendações pessoais ou qualquer garantia de desempenho no futuro.


Preço
25
Vendas
2.1K
Instalações gratuitas