
Descrição
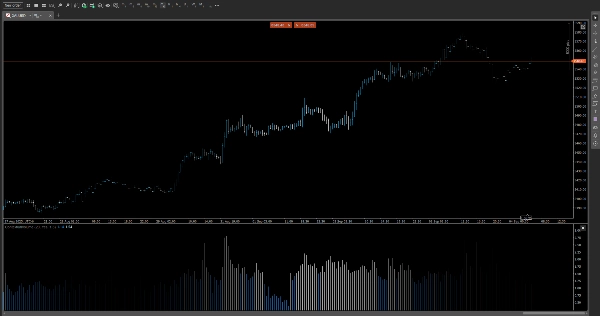
📊 Volume Relativo Intradiário (RVI)
Identifique os picos de volume que importam—quando eles importam.
O RVI é um indicador elaborado com precisão que compara o volume atual com sua média histórica para o mesmo horário do dia, revelando momentos ocultos de momentum e mudanças de liquidez ao longo das sessões intradiárias.
🔍 Principais Características
• Perfil de Volume por Horário
Calcula o volume médio por intervalo de tempo (ex.: 10:15) ao longo das sessões anteriores, fornecendo uma referência contextual para cada candle.
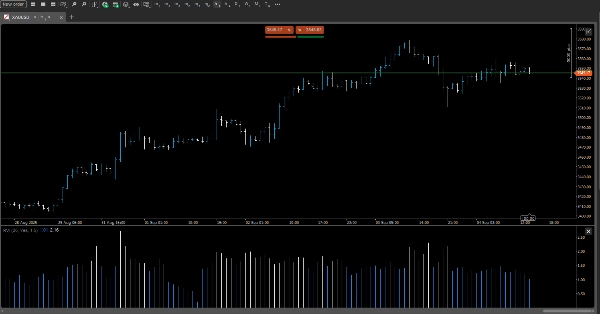
• Suporte Multi-Intervalo
Funciona perfeitamente desde gráficos de 5 minutos até intervalos de 12 horas, adaptando-se ao seu estilo de negociação—scalping, swing ou baseado em sessões.
• Codificação Dinâmica de Cores
Destaca candles com volume acima da média usando limites de cor personalizáveis. Identifique instantaneamente zonas de alta atividade com sinais visuais intuitivos.
• Modo Razão vs. Diferença
Escolha sua métrica preferida:
• Modo Razão: Exibe volume atual ÷ volume médio (ex.: 2,3×)
• Modo Diferença: Mostra a variação absoluta (ex.: +1.200 contratos)
• Exibição em Sobreposição ou Painel
Alterne entre sobreposições inline no gráfico ou um painel lateral compacto para integração limpa com seu layout existente.
🎯 Casos de Uso
• Confirme a força do rompimento com picos de volume relativos à atividade típica
• Filtre sinais falsos durante períodos de baixo volume
• Identifique pegadas institucionais durante janelas intradiárias chave
• Aprimore estratégias baseadas em volume com contexto temporal
⚙️ Opções de Personalização
• Período de retrocesso ajustável para média histórica
• Limites de cor definidos pelo usuário para intensidade de volume
• Alternar modo de exibição (Razão/Diferença)
• Compatível com temas escuro/claro
Resumo
Avaliações de clientes
5 | 100 % | |
4 | 0 % | |
3 | 0 % | |
2 | 0 % | |
1 | 0 % |


![Logótipo de "[Hamster-Coder] Bollinger Bands"](https://cdn.ctrader.com/image/webp/21d8e5d6-fb11-4bac-b9ee-cd05c2b76804_30327)


