
IVB 2.0
Indicador
1 compras
Versão 1.0, Aug 2025
Windows, Mac
4.3
Avaliações: 3
Descrição
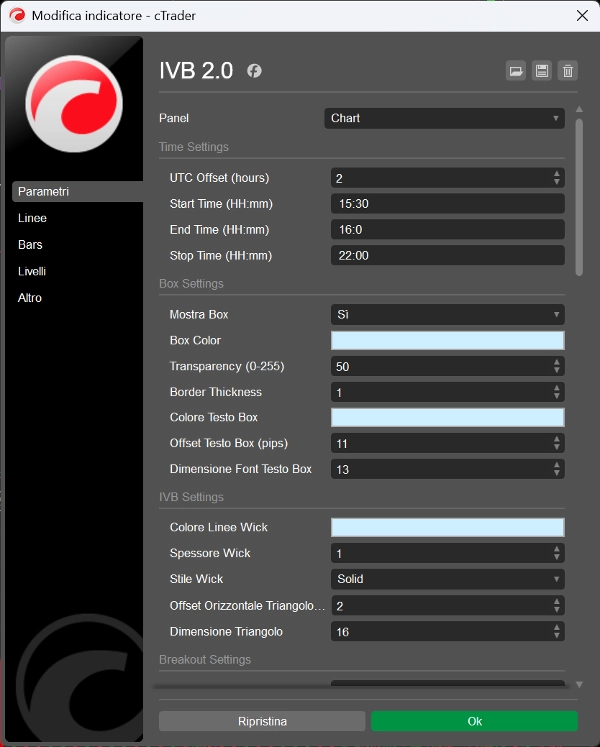
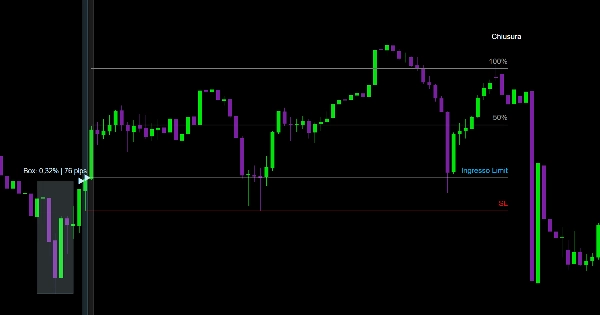
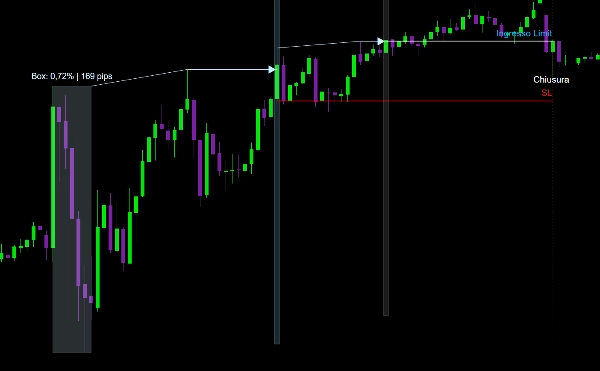
Uma vez definido o intervalo de tempo para criar a caixa de volatilidade, o indicador indica rompimentos, fornece pontos de entrada (Limit ou Market), posicionamento de Stop Loss e níveis de Take Profit nas projeções de 50%/100%/200% assim que essa caixa se desequilibra, sendo totalmente personalizável: você pode ativar ou desativar cada recurso e ajustar as cores conforme sua preferência.
Este indicador é pensado para o timeframe de 5 minutos.
Resumo
Resumo de IA
IVB 2.0 is a trading indicator designed for use on a 5-minute timeframe, focusing on the imbalance within the maximum volatility box of indices. Users define a time range to create this volatility box, after which the indicator signals breakouts and suggests entry points using limit or market orders. It also provides guidance for placing Stop Loss and Take Profit levels at 50%, 100%, and 200% projections once the volatility box becomes imbalanced. The indicator is fully customizable, allowing users to enable or disable individual features and adjust color settings according to their preferences.
Perfil do indicador
Avaliações de clientes
4.3
Avaliações: 3
5 | 33 % | |
4 | 67 % | |
3 | 0 % | |
2 | 0 % | |
1 | 0 % |
Avaliações de clientes
September 14, 2025
September 11, 2025
the first 10 trades should stay boring. The review process gets less scattered.
August 31, 2025
Conversa
Perguntas frequentes
Os produtos disponíveis através da cTrader Store, incluindo bots de negociação, indicadores e plugins, são fornecidos por programadores terceiros e são disponibilizados apenas para fins informativos e de acesso técnico. A cTrader Store não é um corretor e não fornece aconselhamento em matéria de investimento, recomendações pessoais ou qualquer garantia de desempenho no futuro.


Preço
Desde 20/08/2025
1
Vendas