
Descrição
Algoritmo Inteligente de Trailing
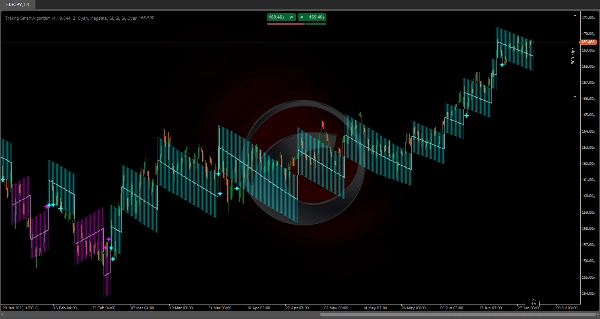
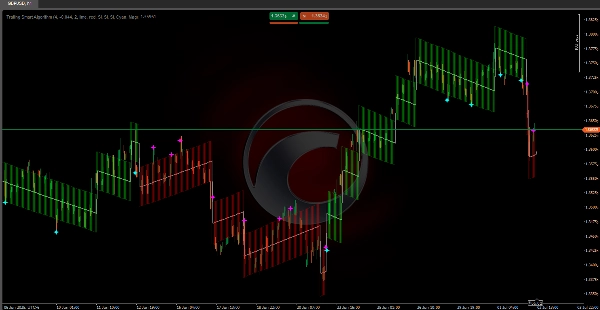
https://chartshots.spotware.com/c/69f0f1d89000b
Incorpora algoritmos matemáticos 🧠 especificamente projetados para acompanhar consistentemente o preço em qualquer condição de mercado 🌐.
Sua estrutura de cálculo garante que a linha de tendência esteja sempre sincronizada com os movimentos de preço, evitando o atraso típico dos indicadores tradicionais ⏳.
Ao contrário dos algoritmos convencionais, este sistema usa medidas precisas de volatilidade 📊 e aplica ajustes automáticos ⚙️ que garantem um acompanhamento ideal. Seus cálculos internos são construídos para fornecer uma representação precisa da direção do mercado, mantendo a precisão durante movimentos rápidos ⚡ e desenvolvimento gradual da tendência 🕊️.
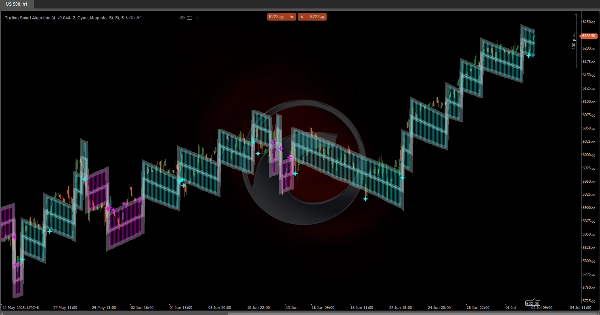
https://chartshots.spotware.com/c/69f0f218591b0
💡 Como Funciona?
O indicador opera usando um sistema de passos adaptativos que se move na direção da tendência dominante.
Baseia-se em três componentes principais:
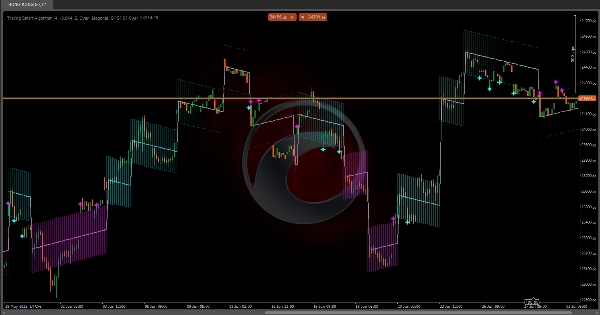
https://chartshots.spotware.com/c/69f0f2b19e4d3
1️⃣ Detecção de Mudança de Tendência
O sistema monitora continuamente o preço para detectar movimentos significativos que excedem um limite específico (Gatilho de Impulso 🎯).
Quando o preço se afasta o suficiente da linha de tendência atual, o indicador reconhece uma potencial mudança de direção e reposiciona sua linha principal.
2️⃣ Trailing Dinâmico
Uma vez definida a direção, a linha de tendência se move passo a passo 🪜 na mesma direção do mercado.
Cada passo é calculado com base na volatilidade atual (ATR 📈):
• Em mercados mais voláteis, os passos são maiores 🌊
• Em mercados mais calmos, os passos são menores 🌿
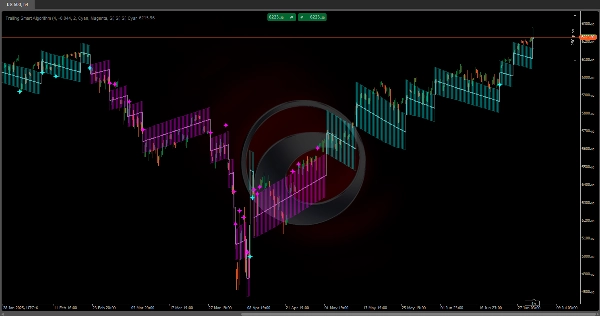
3️⃣ Canal de Volatilidade
Um canal se forma ao redor da linha principal (bandas superior e inferior) representando a zona normal de volatilidade 📉📈.
Este canal ajuda a identificar se o preço está se comportando dentro dos parâmetros normais ou fazendo movimentos extremos 🚨.
📏 Canal de Volatilidade
• Banda Superior: Limite superior do canal de volatilidade
• Banda Inferior: Limite inferior do canal de volatilidade
✨ Sinais de Reteste
• Estrelas Ciano 🌟: O preço toca ou cruza a banda inferior durante uma tendência de alta
• Estrelas Magenta ⭐: O preço toca ou cruza a banda superior durante uma tendência de baixa
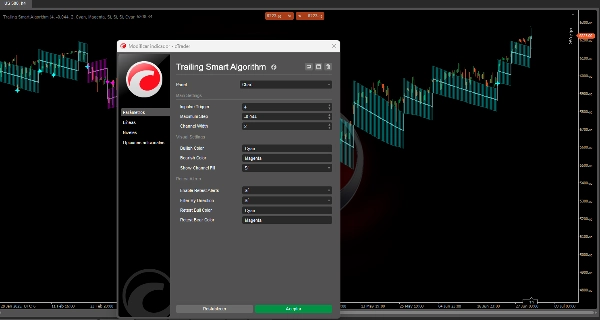
⚙️ Configurações de Parâmetros
🔹 Parâmetros Principais
Gatilho de Impulso (valor padrão: 4)
O que faz?
Determina a sensibilidade para detectar mudanças de tendência. É o multiplicador do ATR que define o quanto o preço deve se mover para disparar uma mudança de direção.
Impacto ao modificar:
• Valores mais altos (5–8):
- Mais resistência a mudanças de tendência 🛡️
- Menos sinais falsos
- Resposta mais lenta a mudanças reais
• Valores mais baixos (2–3):
- Maior sensibilidade 🎯
- Reação mais rápida
- Mais propenso a produzir sinais falsos em mercados laterais
Passo Máximo (valor padrão: -0.044)
O que faz?
Limita o tamanho máximo de cada passo que a linha de tendência pode dar. É um valor negativo que atua como um limite.
Impacto ao modificar:
• Menos negativo (-0.020 a -0.030):
- Passos maiores 🚀
- Acompanhamento de tendência mais agressivo
• Mais negativo (-0.050 a -0.080):
- Passos menores, mais gradativos 🌱
- Acompanhamento mais conservador
Largura do Canal (valor padrão: 2)
O que faz?
Define a largura do canal de volatilidade ao redor da linha principal.
Impacto ao modificar:
• Valores mais altos (3–4):
- Canal mais largo 🟢
- Menos sinais de reteste
- Maior tolerância à volatilidade
• Valores mais baixos (1–1.5):
- Canal mais estreito 🔴
- Mais sinais de reteste
- Mais sensibilidade ao ruído
🎨 Parâmetros Visuais
Cor de Alta / Cor de Baixa
Define as cores para tendências de alta e baixa respectivamente.
Mostrar Preenchimento do Canal
Ativa ou desativa o preenchimento visual do canal de volatilidade 🌈.
🔔 Configurações de Reteste
Ativar Alertas de Reteste
Alterna os sinais de reteste quando o preço toca as bandas do canal.
Filtrar por Direção
Quando ativado, mostra apenas sinais de reteste que correspondem à tendência atual:
• Em uma tendência de alta: Apenas sinais na banda inferior
• Em uma tendência de baixa: Apenas sinais na banda superior
🌟 Resumo dos Sinais de Reteste
• Estrela Ciano na Banda Inferior: Potencial reação de alta a partir do suporte dinâmico ✅
• Estrela Magenta na Banda Superior: Potencial reação de baixa a partir da resistência dinâmica ❌
Resumo
Avaliações de clientes
5 | 100 % | |
4 | 0 % | |
3 | 0 % | |
2 | 0 % | |
1 | 0 % |


