

Descrição
Indicadores da loja Pinescriptlabs: cBots da loja Pinescriptlabs : (cBot) Gold & BTC BreakoutSession Pivots(novo)
Projeção de Liquidez de Preço ZigZag
Algoritmo Inteligente de Trailing (novo)
Mapa de Liquidação de Alavancagem
Previsão Baseada em Linreg & ATR
Suporte & Resistência SmartTrend
Linhas
Lines
Sistema de Rompimento de Canal
Análise
Dinâmica da Estrutura
de Mercado
dos
Pontos
de Virada
Regressão
Linear
Fibonacci
Multi-temporal
Gap de Valor Justo de Momentum
Gradiente de Tendência Dinâmico
Rastreador
de Viés
de Vela Multi-Nível
Rastreador de Extremos Zig-Zag
Linha
de Tendência
de Suporte e
Resistência
Automática
Todos
os Níveis de
Suporte e
Resistência
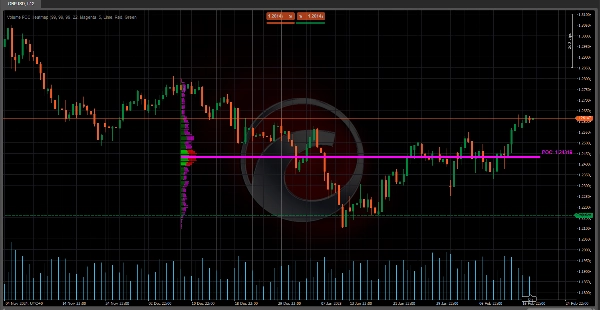
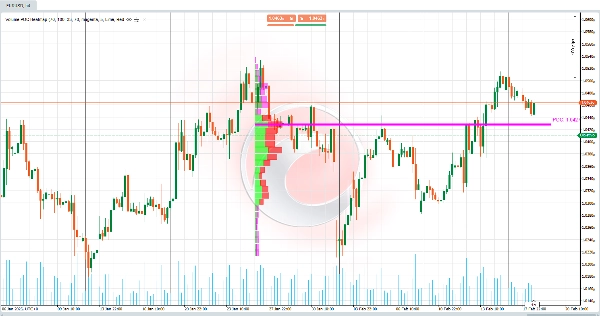
🔥 Mapa de Calor do Volume POC 🔥
Este indicador é um Perfil de Volume que exibe a distribuição do volume negociado em diferentes níveis de preço durante um período específico. Seu principal objetivo é identificar zonas-chave de suporte/resistência e áreas onde o mercado mostrou maior interesse (alta atividade de compra/venda). É super útil para:
- Detectar o Ponto de Controle (POC) 🎯
O nível de preço com o maior volume, atuando como um ímã para a ação do preço. - Visualizar a Área de Valor (VA)
A zona onde uma porcentagem específica do volume total está concentrada (ex.: 70%), indicando equilíbrio entre compradores e vendedores. - Diferenciar Volume de Alta e Baixa 📈📉
Mostra onde o poder de compra vs. pressão de venda se acumula.
🧠 Lógica e Cálculos Principais 🔢
- Divisão do Intervalo de Preço 📏
-
- O intervalo de preço (do menor ao maior nas últimas B Barras ) é dividido em Células de Volume (CNum) .
Exemplo: Se CNum = 33 , o intervalo é dividido em 33 níveis equidistantes.
- O intervalo de preço (do menor ao maior nas últimas B Barras ) é dividido em Células de Volume (CNum) .
- Distribuição de Volume por Nível 📊
-
- Para cada barra nos dados históricos:
-
- O volume associado ao corpo (diferença entre abertura e fechamento) e pavios (máximas e mínimas) é calculado.
- O volume é distribuído proporcionalmente pelas células de preço intersectadas pela barra.
Exemplo: Se uma barra verde (altista) cobre 3 células, o volume é atribuído principalmente a essas células como "volume altista".
- Cálculo do Ponto de Controle (POC) 🎯
-
- O POC é a célula com o maior volume acumulado, representando o preço onde houve maior consenso entre compradores e vendedores.
- Cálculo da Área de Valor (VA) 🔄
-
- Expande-se a partir do POC para cima/baixo até abranger a % especificada do volume total (ex.: 70%).
Exemplo: Se a VA varia de 100 a 105 , significa que 70% do volume foi negociado dentro desse intervalo.
- Expande-se a partir do POC para cima/baixo até abranger a % especificada do volume total (ex.: 70%).
- Normalização Visual 🖼️
-
- Os volumes são escalados usando um Fator de Escala para ajustar a largura das barras no gráfico, facilitando a visualização.
🛠️ Chave do Mapa de Calor do Volume POC 💡
- Falta de Contexto nos Indicadores Tradicionais de Volume 🤔
Indicadores clássicos de volume (como volume barra a barra) não mostram onde o volume foi negociado. Este indicador mapeia o volume por nível de preço, resolvendo esse problema. - Identificação Orgânica de Suporte/Resistência 🚀
Zonas com alto volume atuam como suporte/resistência dinâmicos, mais confiáveis que linhas estáticas. - Detecção de Desequilíbrios ⚖️
Áreas com volume predominantemente altista ou baixista sinalizam potenciais rompimentos ou reversões.
💡 Uso Prático no Trading 📈
- POC como Zona de Interesse 🎯
-
- Se o preço se aproxima do POC, espere reações como repiques ou consolidações.
- Área de Valor (VA) como Zona de Equilíbrio 🔄
-
- Se o preço está fora da VA, tende a retornar a ela (efeito magnético).
- Se o preço está dentro da VA, pode indicar consolidação.
- Volume Altista/Baixista como Confirmação 🔍
-
- Um pico de volume altista na resistência sugere um possível rompimento.
- Alto volume baixista no suporte indica possível queda.
🌟 Exemplo 📊
Parâmetros Usados (Visíveis & Configuráveis pelo Usuário):
- Barras Analisadas = 55 → Número de barras históricas analisadas.
- Células de Volume = 33 → Número de divisões/células no intervalo de preço.
- % do Volume da Área de Valor = 70 → Percentual do volume que define a Área de Valor.
Situação:
- O preço rompe um nível técnico de suporte, mas o volume nessa zona é baixo (de acordo com o perfil).
- Depois, o preço retorna à Área de Valor (VA) definida por 70% do volume total.
Interpretação:
- O rompimento foi falso (devido ao baixo volume na zona de rompimento).
- O mercado busca se reequilibrar dentro da Área de Valor , onde há maior atividade (alta densidade de volume).
Ação:
- Procure oportunidades de compra perto do limite inferior da VA ou do POC, pois são zonas de alto interesse para os participantes do mercado.
Resumo
Key functionalities include:
- Division of the price range into multiple volume cells for detailed volume mapping.
- Calculation of POC as the volume consensus price.
- Determination of the Value Area around the POC.
- Visual normalization of volume bars for clearer chart representation.
This tool addresses the limitation of traditional volume indicators by showing where volume was traded rather than just total volume per bar. It helps identify dynamic support and resistance zones based on volume concentration and detects volume imbalances that may signal potential breakouts or reversals. Traders can use it to anticipate price reactions near the POC and VA, aiding in decision-making for entries and exits. Configurable parameters include the number of historical bars analyzed, volume cells, and the percentage defining the Value Area.
Avaliações de clientes
5 | 100 % | |
4 | 0 % | |
3 | 0 % | |
2 | 0 % | |
1 | 0 % |


