
Description
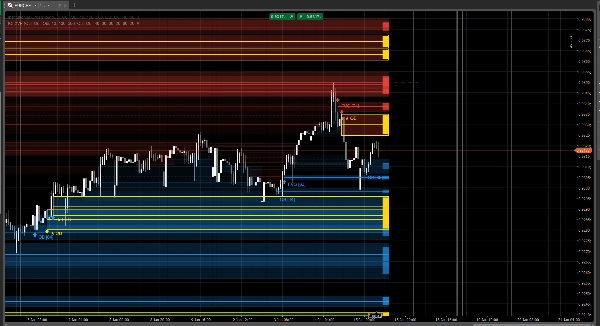
IOF Fusion Zones est une superposition de structure de marché premium qui montre les concepts de flux d'ordres institutionnels (FVG + Blocs d'ordres + Liquidité) avec une visualisation de zone de style « profil de volume » micro.
Au lieu de dessiner des rectangles génériques, chaque zone est notée, pondérée et affichée avec une ligne centrale de style POC et une barre d'intensité, vous aidant à distinguer instantanément le bruit de faible qualité des zones à forte conviction.
Cet outil est conçu pour les traders qui veulent une structure claire + un classement objectif des zones.
Ce qu'il détecte
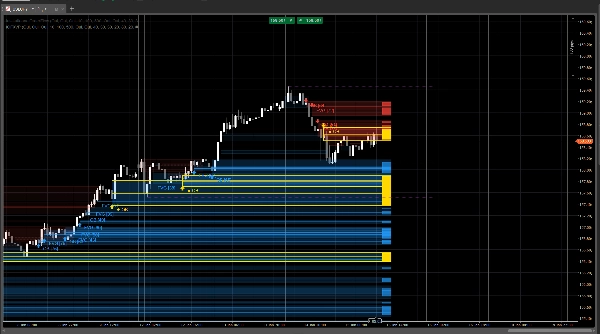
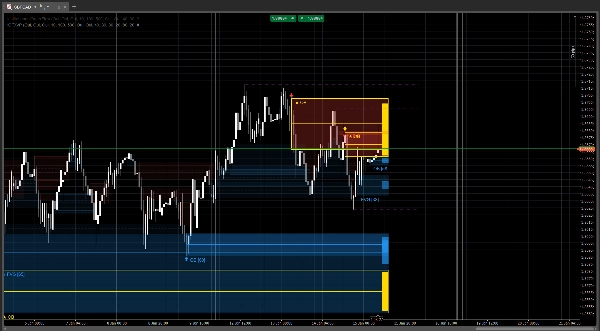
1) Zones IOF intelligentes
- Fair Value Gaps (FVG) utilisant une logique stricte de gap sur 3 barres
- Blocs d'ordres (OB) détectés à partir de la rupture de structure (BOS) (dernière bougie opposée avant déplacement)
- Les zones s'étendent vers l'avant et restent exploitables jusqu'à atténuation ou expiration
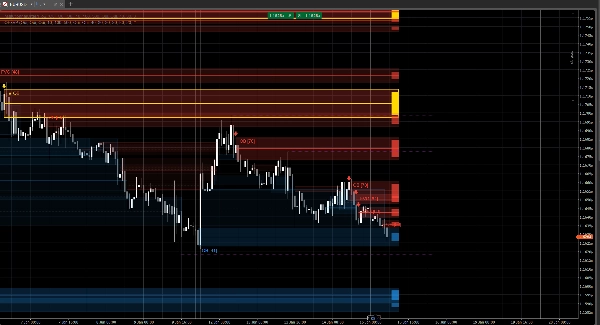
2) Niveaux de liquidité
- Pools de liquidité basés sur les swings (hauts/bas) tracés en niveaux pointillés
- Détecte automatiquement les balayages + comportements de rejet (balayage + clôture repassant le niveau)
Moteur de notation Alpha (0–100)
Chaque zone reçoit un score Alpha basé sur 3 composants pondérés (entièrement configurable) :
- Score Z du volume (force relative du volume)
- Déplacement vs ATR (force du mouvement / qualité de l'impulsion)
- Confluence (proximité avec d'autres zones actives + niveaux de liquidité)
Vous pouvez définir :
- Score minimum à afficher
- Seuil extrême (zones marquées comme premium/majeures)
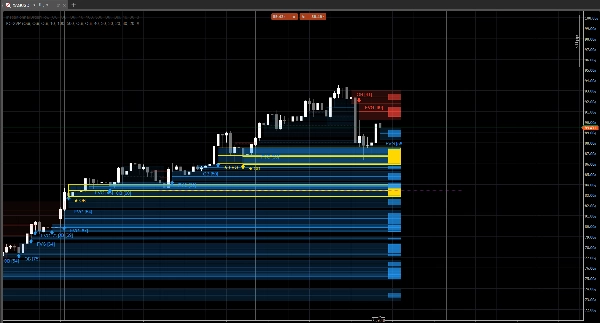
Visualisation Micro-Profile (POC + Intensité)
Chaque zone valide peut afficher :
- Ligne POC (milieu de la zone) — agit comme un « prix de contrôle » clair à l'intérieur de la zone
- Barre d'intensité (style profil de volume) — la hauteur et la luminosité reflètent le score Alpha
- Étiquettes optionnelles, flèches, et bordures extrêmes pour un filtrage instantané
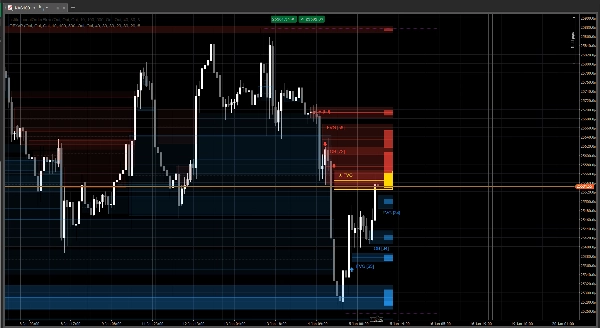
Cela rend les zones lisibles en un coup d'œil :
- faible = faible importance
- remplissage fort + POC en gras = zone de haute qualité
- accent doré = niveau extrême / prioritaire
Logique d'atténuation et de retest
- Les zones suivent le premier retest et peuvent « booster » leur score Alpha après un contact valide
- Les zones atténuées peuvent être :
-
- conservées sur le graphique (style estompé, barré), ou
- complètement supprimées (mode propre)
Analyse historique (contexte rapide)
Lors de la première exécution, l'indicateur peut analyser jusqu'à 2 000 barres (défini par l'utilisateur) pour construire un contexte immédiat :
- zones FVG / OB passées
- niveaux de liquidité
- vérification de l'état d'atténuation
Alertes (optionnel)
Recevez des alertes pour :
- Zones extrêmes
- Premier retest d'une zone valide
(Les alertes sont conçues pour se déclencher uniquement lors d'événements significatifs afin d'éviter le spam.)
Utilisation recommandée
- Identifier les zones de réaction de haute qualité (OB/FVG) classées par score Alpha
- Utiliser les lignes de liquidité pour anticiper les comportements de balayage/rejet
- Se concentrer sur les zones Extrêmes + Alpha élevé où structure + déplacement + volume s'alignent
- Combiner avec votre propre modèle d'exécution et règles de gestion des risques
Avertissement
Cet indicateur est un outil d'aide à la décision, pas un conseil financier. Les conditions de marché varient selon les symboles et les sessions. Toujours effectuer des tests historiques et gérer le risque de manière appropriée.


