Description
L'indicateur MAGIC BLOCK STRATEGY combine deux approches principales de l'analyse de marché :
Détection des blocs d'ordre :
Identifie les zones de support et de résistance basées sur des plus hauts et plus bas ininterrompus dans une période de rétrospection.
Génère des signaux d'achat lorsque le prix clôture au-dessus d'un plus bas ininterrompu.
Génère des signaux de vente lorsque le prix clôture en dessous d'un plus haut ininterrompu.
Analyse de la liquidité :
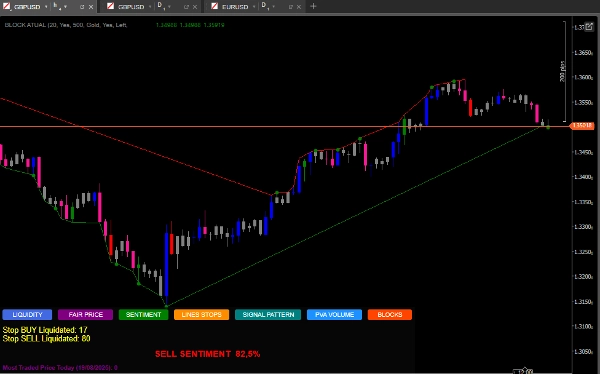
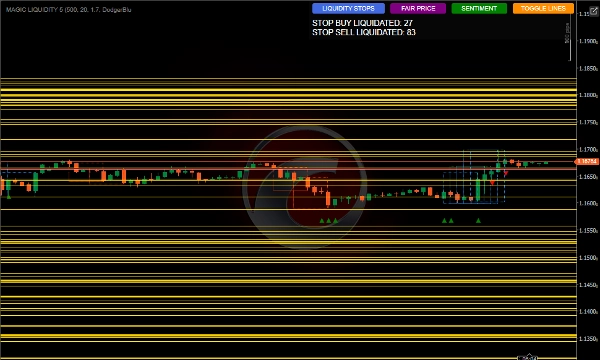
Détecte les zones de pools de liquidité où les stops peuvent être concentrés.
Surveille l'activation des stops d'achat et de vente.
Calcule le sentiment du marché basé sur la distribution de la liquidité.
Identifie le prix équitable le plus échangé.
Comment utiliser pour de meilleurs résultats
Configuration initiale
Période de rétrospection : Ajustez le paramètre Période de rétrospection selon l'unité de temps sur laquelle vous tradez, des valeurs plus élevées pour des unités de temps supérieures.
Nombre de chandeliers pour l'analyse : Gardez-le à 500 pour une analyse robuste ou réduisez-le pour des réactions plus rapides.
Couleur du pool de liquidité : Choisissez une couleur qui ressort sur votre graphique.
Interprétation des signaux
Signaux de bloc d'ordre :
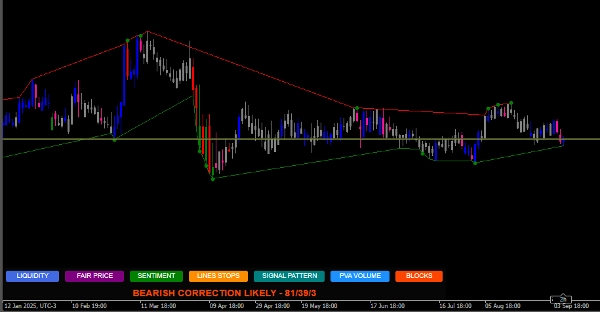
Points verts : signaux d'achat lorsque le prix clôture au-dessus d'un plus bas ininterrompu.
Points rouges : signaux de vente lorsque le prix clôture en dessous d'un plus haut ininterrompu.
Pools de liquidité :
Les lignes horizontales montrent des zones de liquidité, cibles potentielles ou points de retournement.
Surveillez la relation entre la liquidité au-dessus/en dessous du prix actuel.
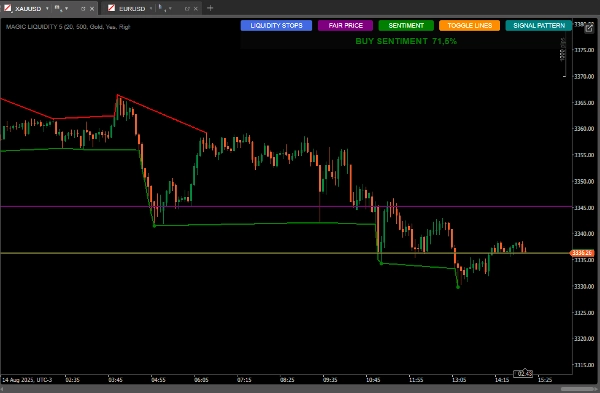
Sentiment du marché :
Utilisez le bouton SENTIMENT pour voir la direction et la confiance dominantes.
Un sentiment d'achat avec une forte confiance suggère une croissance continue. Un sentiment de vente à forte confiance suggère une continuation baissière.
Modèles de chandeliers :
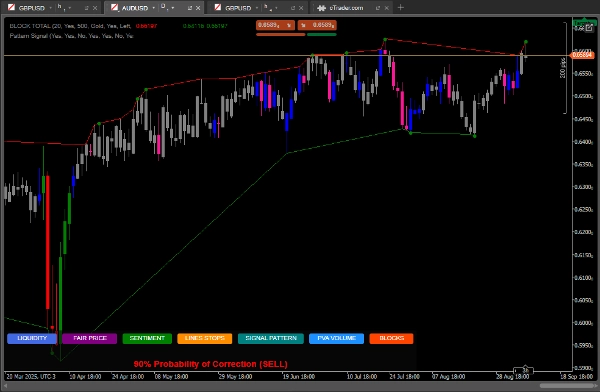
Le bouton SIGNAL PATTERN analyse et
Montre les probabilités de correction basées sur le ratio quantitatif
Prix équitable le plus échangé :
Le bouton PRICE montre le niveau de prix avec le volume le plus élevé de la journée.
Il peut agir comme un aimant pour les prix ou comme support/résistance.
Stratégies d'utilisation
Stratégie conservatrice :
Tradez uniquement lorsque les signaux de bloc d'ordre coïncident avec le sentiment dominant.
Utilisez les pools de liquidité comme objectifs de prise de profit.
Stratégie agressive :
Anticipez les retournements lorsque le prix approche des pools de liquidité avec de nombreux stops accumulés.
Utilisez les divergences entre le sentiment et l'action des prix pour des trades contre la tendance.
Confirmation supplémentaire :
Comparez avec le modèle de chandelier montré par l'indicateur.
Vérifiez si le prix équitable est à proximité comme zone d'intérêt.
Gestion des risques.
Stop-Loss :
Placez-le en dessous du bloc d'ordre le plus récent pour les achats
Placez-le au-dessus du bloc d'ordre le plus récent pour les ventes
Take-Profit :
Objectifs dans les pools de liquidité proches
Considérez le ratio de liquidité au-dessus/en dessous pour fixer les objectifs
Conseils avancés
Utilisez le bouton TOGGLE LINES pour désactiver les lignes de liquidité lorsque le graphique devient encombré
Surveillez le nombre de stops liquidés pour évaluer la force du mouvement
Le prix équitable est particulièrement utile dans les marchés en range comme support/résistance dynamique
Combinez avec d'autres indicateurs pour confirmation volume, moyennes mobiles
SIGNAL PATTERN DISPONIBLE SUR L'UNITÉ DE TEMPS D1.
https://ctrader.com/pt/products/1725?u=Goulart
https://ctrader.com/pt/products/1386?u=Goulart
Résumé
The indicator also analyzes liquidity pools, highlighting areas where stop losses may accumulate and monitoring the activation of buy and sell stops. It calculates market sentiment based on liquidity distribution and identifies the most traded price level of the day, which can act as dynamic support or resistance.
Users can customize parameters such as lookback period and number of candles for analysis to suit different timeframes and trading styles. Visual signals include green and red dots for buy and sell order block signals, horizontal lines for liquidity pools, and sentiment indicators showing prevailing market direction and confidence.
The tool supports conservative strategies that align order block signals with sentiment and use liquidity pools as profit targets, as well as aggressive strategies that anticipate reversals near liquidity pools and exploit divergences between sentiment and price action. Additional features include candlestick pattern correction probabilities and options to toggle liquidity lines for chart clarity. Risk management guidance suggests placing stop-loss orders relative to recent order blocks and setting take-profit targets near liquidity pools.