Description
Indicateur des Sommets et Creux Majeurs : Un Aperçu Complet
Introduction
Dans le monde rapide du trading, disposer des bons outils à votre disposition peut faire toute la différence. L'indicateur des Sommets et Creux Majeurs est conçu pour identifier les points de retournement critiques sur le marché, permettant aux traders de prendre des décisions éclairées. Cet outil puissant utilise des algorithmes avancés pour repérer les hauts et bas significatifs, améliorant ainsi votre stratégie de trading et votre performance globale. Avec un taux de précision moyen d'environ 60 % à 70 % sur la période de 45 minutes, cet indicateur est un atout fiable pour les traders cherchant à tirer parti des mouvements du marché, le rendant idéal tant pour les day traders que pour les scalpers.
Caractéristiques principales
1. Représentation Visuelle
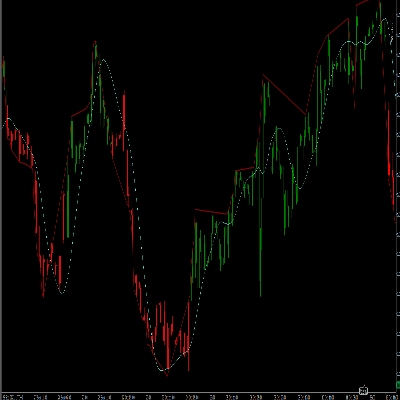
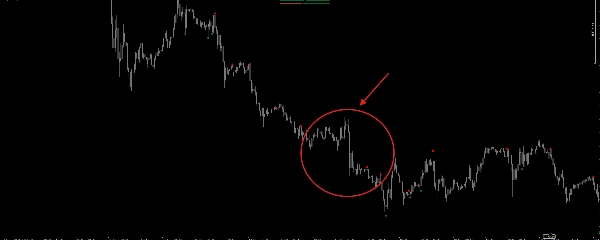
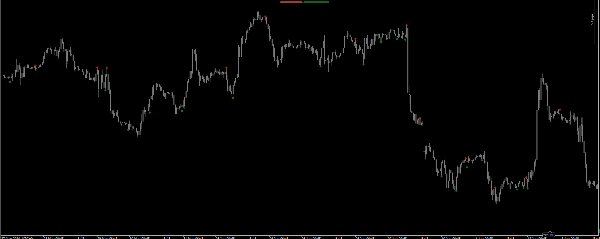
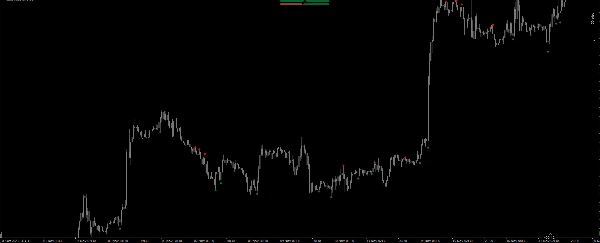
L'indicateur des Sommets et Creux Majeurs offre une représentation visuelle claire de la dynamique du marché. Avec les sommets majeurs marqués en rouge et les creux majeurs en vert, les traders peuvent rapidement identifier les points de retournement potentiels. L'utilisation de points garantit que ces niveaux critiques ressortent sur le graphique, facilitant ainsi la détection des opportunités de trading d'un coup d'œil.
2. Calculs Précis
Le cœur de l'indicateur des Sommets et Creux Majeurs réside dans sa méthode de calcul. En analysant l'action des prix des quatre dernières barres, l'indicateur détermine si un sommet ou un creux majeur s'est formé. Cela est réalisé grâce à une série de comparaisons des prix hauts et bas, garantissant que seuls les points de retournement significatifs sont identifiés.
3. Techniques de Scalping Améliorées
Pour les traders spécialisés dans le scalping, l'indicateur des Sommets et Creux Majeurs est un atout inestimable. En identifiant les points de retournement clés, les traders peuvent entrer et sortir des positions avec précision. La capacité à repérer rapidement les sommets et creux majeurs permet des placements serrés des take profit (TP) et stop loss (SL), minimisant le risque tout en maximisant les gains potentiels. Étant donné sa précision d'environ 60 % à 70 % sur les périodes de 45 minutes, il est fortement recommandé d'utiliser des stop loss pour atténuer les pertes potentielles lorsqu'un signal est manqué.
Avantages de l'utilisation de l'indicateur des Sommets et Creux Majeurs
1. Prise de Décision Améliorée
L'indicateur des Sommets et Creux Majeurs permet aux traders de prendre des décisions éclairées basées sur une analyse précise du marché. En identifiant les hauts et bas significatifs, les traders peuvent mieux anticiper les mouvements de prix et ajuster leurs stratégies en conséquence. Ce processus de prise de décision amélioré renforce la performance globale du trading.
2. Potentiel de Profit Accru
Grâce à la capacité de repérer les points de retournement critiques, les traders peuvent mieux profiter des retournements de marché. L'indicateur des Sommets et Creux Majeurs permet aux traders d'entrer en position aux moments optimaux, augmentant ainsi leur potentiel de profit. En utilisant des niveaux serrés de TP et SL, les traders peuvent maximiser leurs gains tout en minimisant leur exposition au risque.
3. Interface Conviviale
L'indicateur des Sommets et Creux Majeurs est conçu en tenant compte de l'expérience utilisateur. La représentation visuelle claire des sommets et creux majeurs garantit que les traders peuvent facilement interpréter les signaux fournis par l'indicateur. Cette interface conviviale le rend accessible aux traders de tous niveaux d'expérience.
4. Application Polyvalente
Que vous soyez day trader, swing trader ou scalper, l'indicateur des Sommets et Creux Majeurs peut être appliqué à diverses stratégies de trading. Sa polyvalence en fait un ajout précieux à la boîte à outils de tout trader, permettant une plus grande flexibilité pour s'adapter aux différentes conditions du marché.
Conclusion
En conclusion, l'indicateur des Sommets et Creux Majeurs est un outil puissant qui améliore les stratégies de trading en identifiant les points de retournement critiques du marché. Avec ses calculs précis, sa représentation visuelle et sa compatibilité avec la plateforme cTrader, cet indicateur permet aux traders de prendre des décisions éclairées et de tirer parti des mouvements du marché. Avec un taux de précision d'environ 70 %, il est crucial de mettre en place des stop loss pour minimiser les pertes lorsqu'un signal est manqué. Pour des résultats optimaux, il est recommandé d'utiliser cet indicateur sur une période de 45 minutes. Que vous soyez un trader expérimenté ou débutant, l'indicateur des Sommets et Creux Majeurs peut considérablement améliorer vos performances de trading. Élevez votre expérience de trading dès aujourd'hui en intégrant cet outil innovant dans votre stratégie.
Résumé
Avis clients
5 | 50 % | |
4 | 50 % | |
3 | 0 % | |
2 | 0 % | |
1 | 0 % |