
LT_Ind_SRZones
Indicateur
3 achats
Version 1.0, Oct 2025
Windows, Mac
4.6
Avis : 3
Description
Remarque : testé uniquement sur cTrader Windows.
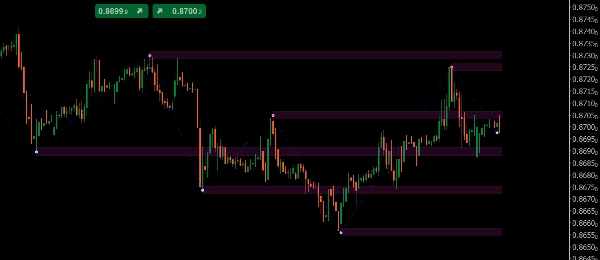
LT_Ind_SRZones détecte les hauts/bas de swing, fusionne les swings proches en zones de support/résistance, et maintient votre graphique centré sur les niveaux les plus pertinents autour du prix actuel.
Ce qu'il dessine
- Zones : bandes ombrées construites à partir des swings fusionnés
- Points hauts/bas de swing
- ZigZag : chemin pour une lecture rapide de la structure
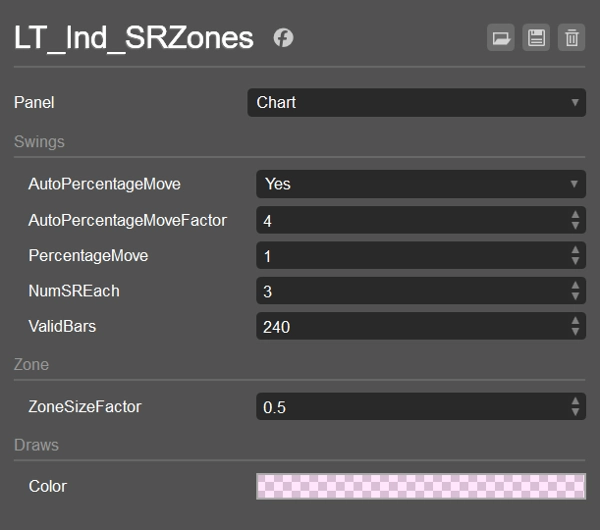
Contrôles clés
- AutoPercentageMove (bool) + AutoPercentageMoveFactor (double)
Ajuste automatiquement la sensibilité des swings. Désactivez pour utiliser PercentageMove manuellement. - PercentageMove (double)
Mouvement minimum (en %) pour former un swing lorsque Auto est désactivé. - ZoneSizeFactor (double)
Hauteur de la zone =ZoneSizeFactor × ATR. - NumSREach (int)
Combien de meilleures zones garder au-dessus et en dessous du prix actuel. - ValidBars (int)
Ignorer les swings plus anciens que ce nombre de barres. - Styles de couleur / affichage
Couleur de remplissage de la zone (avec alpha), styles Swing/ZZ.
Logique de tri et de filtrage (comment les zones sont choisies)
- Collecter les swings du plus récent au plus ancien, seulement les permanents et pas plus vieux que
ValidBars. - Compter les swings au-dessus et en dessous du prix actuel (y compris ceux dont la valeur tombe à l'intérieur de la moitié d'une zone). Arrêter lorsque les deux côtés atteignent
NumSREach. - Solution de secours : si un côté n'a aucun swing éligible, ajouter un swing plus ancien pour ce côté.
- Fusionner : pour chaque swing éligible, soit fusionner dans une zone existante (
CanMerge) soit créer une nouvelle zone. - Classer & choisir :
-
- Au-dessus du prix : trier les zones par (Haut − prix) croissant, puis par MostRecentIndex décroissant ; prendre
NumSREach. - En dessous du prix : trier par (prix − Bas) croissant, puis par MostRecentIndex décroissant ; prendre
NumSREach. - Union des deux listes → zones finales affichées.
- Au-dessus du prix : trier les zones par (Haut − prix) croissant, puis par MostRecentIndex décroissant ; prendre
Cela maintient l'affichage propre, proche et récent, tout en gérant les cas limites.
Valeurs par défaut
- AutoPercentageMove = true, AutoPercentageMoveFactor = 4
- PercentageMove = 1.0 (utilisé lorsque Auto = false)
- NumSREach = 1
- ValidBars = 240
- ZoneSizeFactor = 0.5 (hauteur de la zone = 0.5 × ATR)
- Couleur de la zone = #21FF33E0 (semi-transparent)
- Swing High = #FFFF999A, Swing Low = #FF99DFF9, ZigZag = Bleu (Points)
Cas d'utilisation
- Marquer les zones S/R proches pour les entrées, les sorties partielles ou les stops
- Surveiller les inversions de zone (support → résistance et vice versa)
- Combiner avec VWAP/Pivots pour la confluence
Fonctionne sur n'importe quel symbole et intervalle de temps. Léger et prêt pour le trading en direct ou les backtests.
Résumé
Résumé IA
LT_Ind_SRZones is an indicator designed for cTrader Windows that automatically identifies and displays support and resistance zones derived from swing highs and lows. It detects swing points, merges nearby swings into shaded support/resistance zones, and highlights the most relevant levels around the current price to maintain a clear chart view. The indicator also plots swing high/low points and a ZigZag path for quick structural analysis.
Key adjustable parameters include automatic or manual swing sensitivity settings, zone size based on a factor of the Average True Range (ATR), the number of top zones to display above and below the current price, and the maximum age of swings considered. The indicator filters and ranks zones by proximity and recency, ensuring the display focuses on recent and nearby levels.
LT_Ind_SRZones works on any symbol and timeframe, supporting markets such as Forex, indices, commodities, cryptocurrencies, and stocks. It is suitable for live trading and backtesting. Typical use cases include marking nearby support/resistance zones for trade entries, stops, or partial exits, monitoring zone flips (support to resistance and vice versa), and combining with other indicators like VWAP or pivots for confluence.
Profil de l'indicateur
Avis clients
4.6
Avis : 3
5 | 67 % | |
4 | 33 % | |
3 | 0 % | |
2 | 0 % | |
1 | 0 % |
Avis clients
October 22, 2025
October 15, 2025
the routine feels easier to keep, but the chart still needs a human read.
Discussion
Questions fréquentes
Prop
Forex
Indices
Commodities
Crypto
Stocks
Les produits disponibles sur cTrader Store, notamment les bots de trading, les indicateurs et les plug-ins, sont fournis par des développeurs tiers et mis à disposition à titre informatif et à des fins d'accès technique uniquement. cTrader Store n'est pas un courtier et ne fournit aucun conseil en investissement, aucune recommandation personnelle ni aucune garantie quant aux performances futures.


Prix
Depuis le 25/09/2024
34
Ventes