
Description
Visualiseur dynamique Dot Momentum %BB pour cTrader
Quantifiez la volatilité. Visualisez le momentum. Maîtrisez vos entrées.
Libérez la puissance de la volatilité avec le Visualiseur dynamique Bollinger Bands %B, un indicateur personnalisé unique pour cTrader conçu pour vous offrir une compréhension inégalée de l'action des prix par rapport à son enveloppe de volatilité. Allant au-delà des bandes de Bollinger traditionnelles, cet indicateur transforme des métriques complexes de volatilité en un flux intuitif de cercles codés par couleur, vous aidant à identifier les points de retournement cruciaux du marché et la force de la tendance.
Qu'est-ce que le Bollinger Bands %B et en quoi diffère-t-il ?
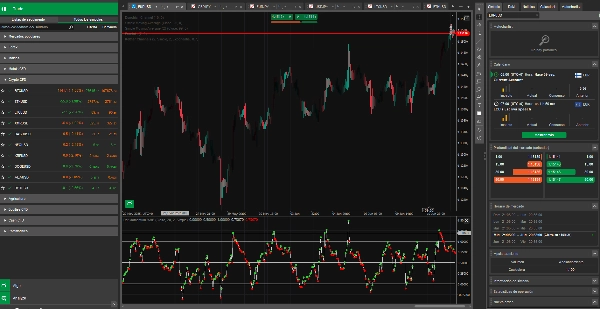
Alors que les bandes de Bollinger standard se superposent directement à votre graphique de prix, montrant un support/résistance dynamique et représentant visuellement la volatilité du marché par leur expansion et contraction, le Bollinger Bands %B est un oscillateur. Il est affiché dans un panneau séparé sous votre graphique principal, fournissant une mesure quantifiable de la position actuelle du prix au sein de l'enveloppe des bandes de Bollinger.
Il ne montre pas directement le prix ; à la place, il révèle la position relative du prix sur une échelle de 0 à 1 :
- 0.0 : Le prix est à la bande de Bollinger inférieure.
- 0.5 : Le prix est à la bande de Bollinger médiane (la moyenne mobile).
- 1.0 : Le prix est à la bande de Bollinger supérieure.
Avantages & Contexte de Volatilité :
Cet indicateur va au-delà de la simple observation. Il quantifie la position du prix par rapport à sa volatilité inhérente, vous permettant de :
- Évaluer la force de la tendance : Un %B persistant au-dessus de 0,5 suggère un fort momentum haussier, tandis qu'en dessous de 0,5 indique une pression baissière.
- Identifier les retournements potentiels : Des lectures extrêmes (proches de 0,0 ou 1,0) peuvent signaler que le prix est trop étendu dans sa plage de volatilité actuelle.
- Comprendre la volatilité contextuelle : La volatilité elle-même (représentée par la largeur des bandes de Bollinger sous-jacentes) est toujours contextuelle à la période temporelle que vous visualisez. Une lecture %B sur un graphique horaire reflète la volatilité différemment que sur un graphique journalier. Notre indicateur s'adapte parfaitement à votre période choisie, fournissant des informations pertinentes.
Caractéristiques techniques :
- Calcul précis : %B est calculé comme : (Prix actuel − Bande inférieure)/(Bande supérieure − Bande inférieure)
- Codage couleur dynamique (cercles) :
-
- Cercles vert citron : Indiquent que la valeur %B augmente par rapport à la barre précédente, signalant un momentum haussier.
- Cercles rouges : Indiquent que la valeur %B diminue par rapport à la barre précédente, signalant un momentum baissier.
- Cercles argentés : Affichés lorsque la valeur %B reste inchangée ou pour le tout premier point valide.
- Ligne de chemin subtile : Une ligne fine gris clair suit subtilement le chemin global de la valeur %B, offrant une continuité visuelle sous les cercles dynamiques.
- Marqueurs de niveau discrets : Des lignes solides gris foncé à 0,0, 0,5 et 1,0 (facilement visibles sans dominer la visualisation principale) fournissent des points de référence clairs pour les extrêmes de volatilité et la moyenne.
- Personnalisable : Ajustez la période des bandes de Bollinger, les écarts-types et le type de moyenne mobile directement depuis les paramètres.
Explication simplifiée : Signaux de sur-volatilité (comme un RSI pour la volatilité !)
Considérez cet indicateur comme un RSI, mais pour la sur-extension de la volatilité plutôt que pour de simples niveaux de surachat/survente des prix.
- Lorsque les cercles touchent ou descendent en dessous de 0,0, cela signifie que le prix pousse fortement contre le bas de son enveloppe de volatilité actuelle. C'est comme un signal de "volatilité survendue", suggérant que le marché pourrait être trop étiré à la baisse dans son contexte actuel.
- Lorsque les cercles touchent ou dépassent 1,0, cela signifie que le prix pousse fortement contre le haut de son enveloppe de volatilité actuelle. C'est comme un signal de "volatilité surachetée", suggérant que le marché pourrait être trop étiré à la hausse dans son contexte actuel.
Ces lectures extrêmes ne signifient pas nécessairement "acheter" ou "vendre" immédiatement, mais elles sont des alertes puissantes indiquant que le marché est à un point extrême dans sa plage typique de mouvement pour cette période temporelle spécifique. Cela précède souvent une possible réversion vers la moyenne ou un changement dans le comportement de la volatilité du marché.
Résumé
Avis clients
5 | 0 % | |
4 | 100 % | |
3 | 0 % | |
2 | 0 % | |
1 | 0 % |


![Logo de "[Stellar Strategies] Market Session Ultimate"](https://cdn.ctrader.com/image/webp/61ffd537-0125-4246-9e72-42eca1791d64_28232)


