
Sero
Chỉ báo
105 lượt tải
Phiên bản 1.0, Mar 2026
Windows, Mac
Mô tả
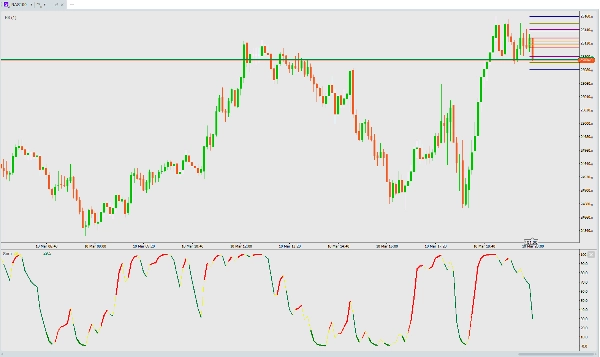
Sero — Bộ dao động Đà
Sero là một bộ dao động đà dựa trên stochastic cung cấp các tín hiệu trực quan rõ ràng, được mã màu cho sự thay đổi đà thị trường.
Cách hoạt động
Sero tính toán giá trị stochastic đã được làm mượt từ Giá điển hình (Cao+Thấp+Đóng)/3 trong phạm vi 15 thanh, sau đó áp dụng EMA nhanh 2 kỳ để tạo ra bộ dao động phản ứng từ 0–100.
Những điều cần chú ý
Màu sắc kể câu chuyện:
- Đường màu vàng — giá trị cơ bản của Sero (luôn hiển thị)
- Đường màu đỏ — đà tăng (Sero đang tăng)
- Đường đỏ dày — đà tăng mạnh (tăng + trên 20 — xác nhận phá vỡ khỏi vùng quá bán)
- Đường màu xanh lá — đà giảm (Sero đang giảm)
- Đường xanh lá dày — đà giảm mạnh (giảm + dưới 20 — sâu trong vùng quá bán)
Các tín hiệu chính:
- Tín hiệu mua — Màu chuyển từ Xanh lá sang Đỏ, đặc biệt từ dưới 20 (đảo chiều quá bán)
- Tín hiệu bán — Màu chuyển từ Đỏ sang Xanh lá, đặc biệt từ trên 80 (đảo chiều quá mua)
- Xu hướng mạnh — Đường dày xác nhận sự chắc chắn của đà
- Sự kiệt sức — Đường xanh lá dày dưới 20 = người bán có thể đang hết sức, chú ý đảo chiều
Thực hành tốt nhất
- Hoạt động trên bất kỳ khung thời gian nào và bất kỳ công cụ nào
- Kết hợp với hành động giá hoặc các mức hỗ trợ/kháng cự để xác nhận
- Chuyển màu gần các cực (0 hoặc 100) là các tín hiệu có xác suất cao nhất
- Không cần cài đặt — đã được tối ưu và sẵn sàng sử dụng ngay
Tóm tắt
Tóm tắt AI
Sero is a stochastic-based momentum oscillator designed to identify market momentum shifts through clear, color-coded visual signals. It calculates a smoothed stochastic value from the Typical Price [(High + Low + Close) / 3] over a 15-bar range, then applies a fast 2-period exponential moving average (EMA) to generate a responsive oscillator ranging from 0 to 100.
The indicator displays multiple colored lines to represent momentum states:
- Yellow line: base Sero value (always visible)
- Red line: bullish momentum (rising oscillator)
- Thick red line: strong bullish momentum (rising and above 20, indicating breakout from oversold)
- Green line: bearish momentum (falling oscillator)
- Thick green line: strong bearish momentum (falling and below 20, indicating deep oversold conditions)
Key signals include buy signals when the color flips from green to red, especially below 20 (oversold reversal), and sell signals when it flips from red to green, especially above 80 (overbought reversal). Thick lines confirm strong momentum trends, while thick green lines below 20 may indicate exhaustion of selling pressure and potential reversal.
Sero works on any timeframe and instrument without requiring user settings, and it is recommended to combine it with price action or support/resistance levels for confirmation. Color transitions near extremes (0 or 100) provide the highest-probability signals.
Hồ sơ chỉ báo
Đánh giá của khách hàng
0.0
Đánh giá: 0
Đánh giá của khách hàng
Sản phẩm này chưa có đánh giá nào. Bạn đã dùng thử chưa? Hãy là người đầu tiên chia sẻ với mọi người!
Thảo luận
Câu hỏi thường gặp
BTCUSD
Forex
Signal
Indices
EURUSD
Commodities
GBPUSD
NZDUSD
Crypto
Stocks
XAUUSD
NAS100
USDJPY
Các sản phẩm có sẵn trên cTrader Store, bao gồm bot giao dịch, chỉ báo và plugin, được cung cấp bởi các nhà phát triển bên thứ ba và chỉ nhằm mục đích cung cấp thông tin và tiếp cận kỹ thuật. cTrader Store không phải là nhà môi giới và không cung cấp lời khuyên đầu tư, khuyến nghị cá nhân hay bất kỳ đảm bảo nào về hiệu suất trong tương lai.
Sản phẩm khác của tác giả này


Giá
Kể từ 10/03/2026
105
Cài đặt miễn phí