
LT_Ind_VWAP
Indicateur
2 achats
Version 1.0, Oct 2025
Windows, Mac
4.5
Avis : 2
Description
Remarque : Testé uniquement sur cTrader Windows.
LT_Ind_VWAP est un indicateur VWAP ancré pratique pour cTrader.
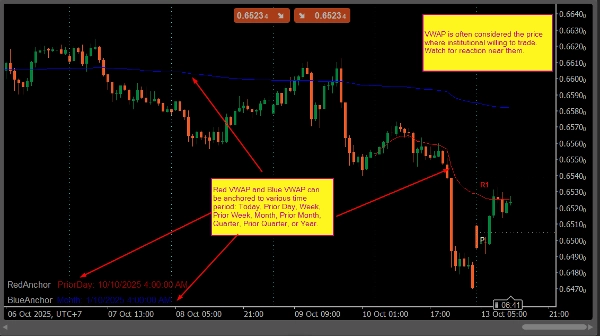
Il trace deux lignes VWAP (Rouge et Bleue) qui peuvent chacune être ancrées à une période sélectionnée, telle que Aujourd’hui, Jour précédent, Semaine, Semaine précédente, Mois, Mois précédent, Trimestre, Trimestre précédent ou Année.
L’indicateur se recalcule automatiquement lorsqu’un nouveau jour commence et affiche l’ancre active ainsi que la date directement sur le graphique. Il est conçu pour les traders qui utilisent les niveaux VWAP pour suivre la juste valeur, l’orientation de la tendance ou les zones de retour à la moyenne.
Principales fonctionnalités
- Deux lignes VWAP avec des ancres indépendantes
- Ancres prises en charge : Aujourd’hui, Jour précédent, Semaine, Semaine précédente, Mois, Mois précédent, Trimestre, Trimestre précédent, Année
- Recalcul automatique au changement de session
- Informations sur l’ancre affichées sur le graphique
- Configuration simple, utilisation minimale des ressources
Paramètres par défaut
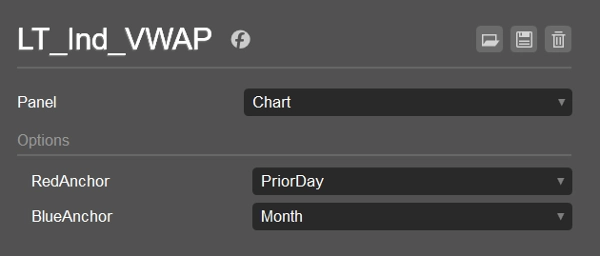
- VWAP Rouge : Jour précédent
- VWAP Bleu : Mois
Cas d’utilisation
- Comparer le prix intrajournalier avec le VWAP du jour précédent
- Surveiller le VWAP mensuel ou trimestriel pour l’orientation du swing
- Trouver la confluence entre les niveaux VWAP à court et long terme
Résumé
Résumé IA
LT_Ind_VWAP is an anchored VWAP (Volume Weighted Average Price) indicator designed for the cTrader platform (Windows version). It displays two independent VWAP lines—red and blue—each anchored to selectable time periods including Today, Prior Day, Week, Prior Week, Month, Prior Month, Quarter, Prior Quarter, or Year. The indicator automatically recalculates at the start of a new trading session and shows the active anchor and date on the chart for easy reference. Its primary use cases include comparing intraday prices with prior-day VWAP, monitoring monthly or quarterly VWAP for swing trading bias, and identifying confluence between short- and long-term VWAP levels. The default settings anchor the red VWAP to the prior day and the blue VWAP to the current month. LT_Ind_VWAP offers a simple setup with minimal resource consumption, making it suitable for traders who rely on VWAP levels to assess fair value, trend direction, or mean-reversion zones across various markets such as Forex, indices, commodities, cryptocurrencies, and stocks.
Profil de l'indicateur
Avis clients
4.5
Avis : 2
5 | 50 % | |
4 | 50 % | |
3 | 0 % | |
2 | 0 % | |
1 | 0 % |
Avis clients
October 26, 2025
Discussion
Questions fréquentes
Prop
Forex
Indices
Commodities
Crypto
Stocks
VWAP
Les produits disponibles sur cTrader Store, notamment les bots de trading, les indicateurs et les plug-ins, sont fournis par des développeurs tiers et mis à disposition à titre informatif et à des fins d'accès technique uniquement. cTrader Store n'est pas un courtier et ne fournit aucun conseil en investissement, aucune recommandation personnelle ni aucune garantie quant aux performances futures.


Prix
Depuis le 25/09/2024
34
Ventes