
설명
상위 타임프레임 캔들 트래커는 선택한 상위 타임프레임 캔들이 어떤 모습인지 엿볼 수 있도록 사용됩니다.
주요 특징:
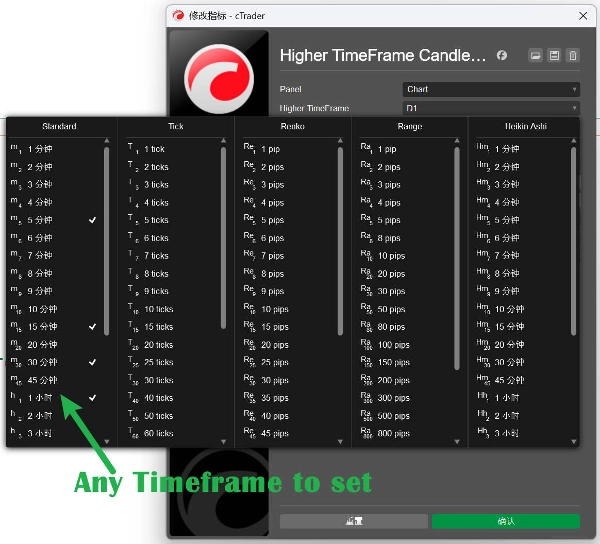
- 사용자 지정 가능한 타임프레임 선택 - 원하는 상위 타임프레임 선택 (일간, 주간, 월간 등)
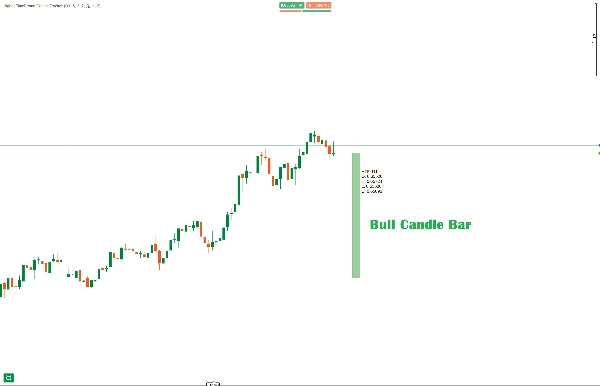
- 시각적 캔들 표시 - 현재 HTF 캔들을 적절한 심지와 몸통으로 현재 가격 움직임에서 오프셋하여 표시
조정 가능한 설정:
- 오프셋: 현재 가격에서 바 단위 거리 (기본값: 5)
- 캔들 너비: 캔들 몸통 두께 (1-10, 기본값: 3)
- 심지 너비: 심지 선 두께 (1-5, 기본값: 1)
- 색상: 사용자 지정 가능한 상승(녹색) 및 하락(빨강) 색상
지원 타임프레임:
- Minute, Minute2, Minute3, Minute4, Minute5
- Minute10, Minute15, Minute30, Minute45
- Hour, Hour4, Hour12
- Daily, Day2, Day3
- Weekly, Monthly
정보 표 - 실시간 HTF 캔들 데이터 표시: 시가, 고가, 저가, 종가 값.
中文说明:
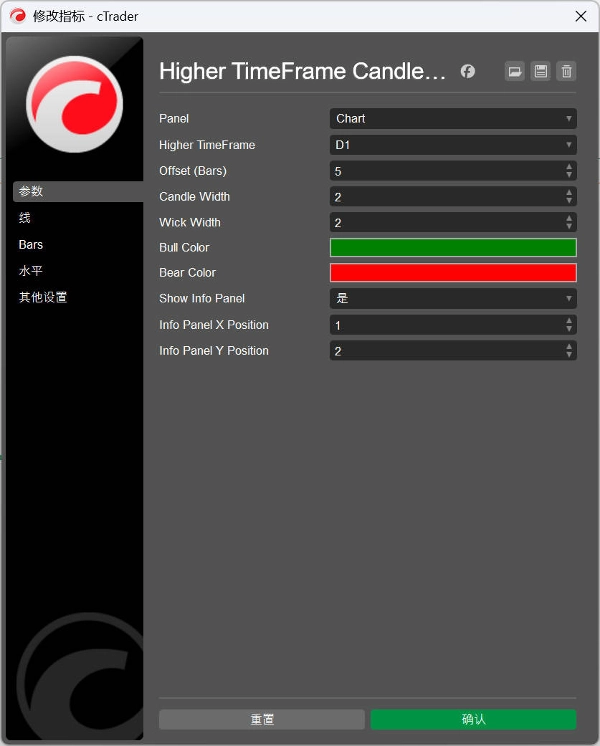
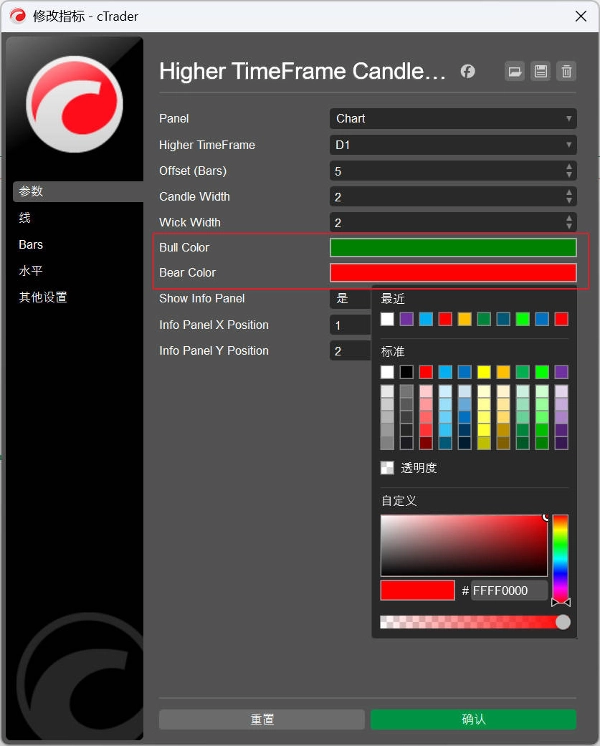
사용자 지정 가능한 매개변수:
- Higher TimeFrame(고시간 프레임) - 추적할 시간 프레임 선택 (기본값: Daily)
- Offset(오프셋) - 캔들이 현재 가격에서 떨어진 위치 (기본값: 5개 캔들)
- Candle Width(캔들 너비) - 캔들 몸통 너비 (1-10, 기본값: 3)
- Wick Width(심지 너비) - 심지 너비 (1-5, 기본값: 2)
- Bull Color(상승 색상) - 상승 캔들 색상 (기본값: Green)
- Bear Color(하락 색상) - 하락 캔들 색상 (기본값: Red)
- Show Info Panel(정보 패널 표시) - HTF 데이터 패널 표시 여부 (기본값: true)
핵심 특성:
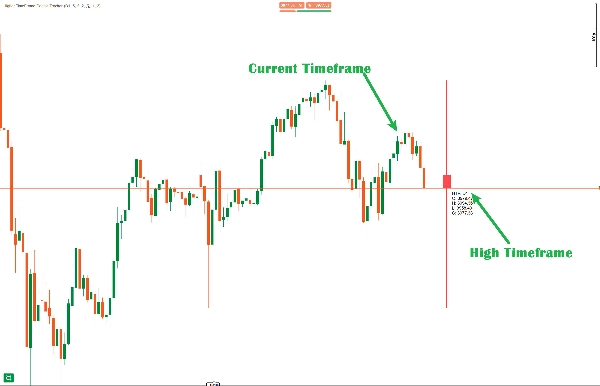
- 실시간 HTF 캔들 표시 - 차트에 현재 상위 타임프레임 캔들 표시
- 완전한 캔들 구조 - 몸통, 상단 심지 및 하단 심지 포함
- 색상 구분 - 상승과 하락에 따라 자동으로 다른 색상 사용
- 정보 패널 - 시가, 고가, 저가, 종가 및 방향 표시
- 적응형 채우기 - 상승 캔들은 반투명, 하락 캔들은 더 진하게 표시
지원 타임프레임:
- Minute, Minute2, Minute3, Minute4, Minute5
- Minute10, Minute15, Minute30, Minute45
- Hour, Hour4, Hour12
- Daily, Day2, Day3
- Weekly, Monthly
요약
지표 프로필
고객 리뷰
0.0
리뷰: 0
고객 리뷰
이 상품에 대한 리뷰가 아직 없습니다. 이미 사용해 보셨나요? 다른 사람들에게 가장 먼저 소개해 주세요!
상담
자주 묻는 질문(FAQ)
Prop
Forex
Breakout
Indices
Commodities
Crypto
Stocks
트레이딩 봇, 지표, 플러그인 등 cTrader Store에서 제공되는 상품은 제3자 개발자에 의해 제공되며, 이는 단순히 정보 및 기술적 접근을 목적으로 제공된 것입니다. cTrader Store는 중개인이 아니며, 투자 조언, 개인별 추천 또는 향후 성과에 대한 어떠한 보장도 제공하지 않습니다.


가격
가입일 30/09/2024
44
판매