
Mô tả
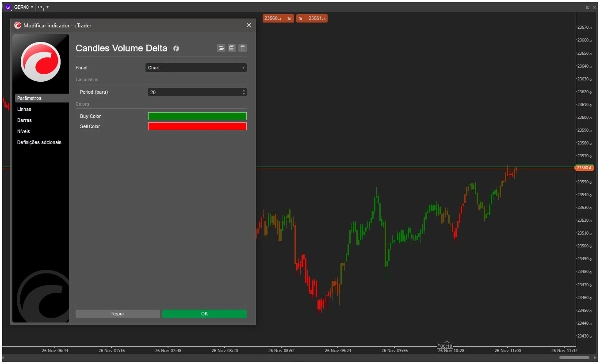
Candles Volume Delta là một chỉ báo mạnh mẽ, trực quan giúp chuyển đổi khối lượng tick thô thành những hiểu biết giao dịch có thể hành động được. Bằng cách tô màu các thanh giá dựa trên áp lực khối lượng mua/bán, nó cung cấp một tín hiệu thị giác ngay lập tức về tâm lý và sức mạnh thị trường, giúp bạn phát hiện các khả năng tiếp diễn hoặc đảo chiều xu hướng chỉ trong nháy mắt.
Các Tính Năng Chính
-
- 🟢 Phân Tích Khối Lượng Trực Quan: Tô màu mỗi thanh giá dựa trên sự chiếm ưu thế khối lượng mua/bán
- 📊 Tính Toán Delta Thông Minh: Tính toán delta khối lượng trong khoảng thời gian do người dùng định nghĩa
- 🎨 Màu Sắc Tùy Chỉnh: Bộ màu mua/bán hoàn toàn có thể điều chỉnh
- ⚡ Xử Lý Thời Gian Thực: Tối ưu cho phản hồi trực quan ngay lập tức trên các thanh mới
- 🛠️ Cài Đặt Dễ Dàng: Cấu hình đơn giản với các thiết lập mặc định hợp lý
Cách Hoạt Động
Candles Volume Delta phân tích khối lượng tick trong khoảng thời gian bạn chỉ định (mặc định: 20 thanh) và tính tỷ lệ phần trăm khối lượng mua so với khối lượng bán:
-
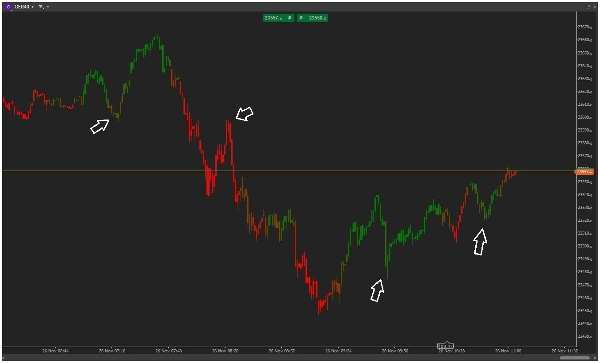
- Thanh Xanh Lá: Áp lực mua cao (thường >60% khối lượng mua)
- Thanh Đỏ: Áp lực bán cao (thường <40% khối lượng mua)
- Màu Sắc Gradient: Chuyển đổi màu mượt mà thể hiện các mức độ sức mạnh trung gian
Chỉ báo sử dụng làm mượt dựa trên ATR để đảm bảo tín hiệu ổn định, có ý nghĩa và thích ứng với biến động thị trường hiện tại.
Ứng Dụng Giao Dịch
-
- Xác Nhận Xu Hướng: Xác thực sức mạnh xu hướng với sự xác nhận khối lượng
- Tín Hiệu Đảo Chiều: Phát hiện khả năng đảo chiều khi hành động giá mâu thuẫn với dòng khối lượng
- Xác Nhận Phá Vỡ: Xác nhận các đột phá với bằng chứng khối lượng hỗ trợ
- Tâm Lý Thị Trường: Đánh giá sự chiếm ưu thế tổng thể của người mua/người bán trong bất kỳ khung thời gian nào
Tại Sao Chọn Candles Volume Delta?
Khác với các chỉ báo khối lượng phức tạp làm rối biểu đồ của bạn, Candles Volume Delta cung cấp phản hồi trực quan ngay lập tức thông qua mã màu đơn giản. Nó nhẹ, nhanh và cung cấp cho bạn thông tin khối lượng thiết yếu mà không làm bạn quá tải dữ liệu.
Hoàn hảo cho các nhà giao dịch muốn:
-
- Đánh giá nhanh tâm lý thị trường
- Phân tích biểu đồ sạch, không rối mắt
- Xác nhận trực quan các chuyển động giá
- Dễ dàng tích hợp vào các chiến lược hiện có
Cài đặt ngay hôm nay và quan sát thị trường qua lăng kính động lực khối lượng!
Tóm tắt
Key features include customizable color schemes, real-time processing for instant visual feedback, and easy setup with sensible defaults. The indicator helps traders quickly assess market sentiment, confirm trends, identify potential reversals, validate breakouts, and gauge buyer/seller dominance across timeframes. It is designed to provide essential volume insights without cluttering the chart, making it suitable for integration into various trading strategies, including scalping and trend analysis. Supported markets include indices and other instruments where volume analysis is relevant.
Đánh giá của khách hàng
5 | 100 % | |
4 | 0 % | |
3 | 0 % | |
2 | 0 % | |
1 | 0 % |


![Logo "[Stellar Strategies] Inside Bar with Signals"](https://cdn.ctrader.com/image/webp/1d9e8bfa-3b2c-4440-bb37-5856902008a7_30683)


