
Frac Support Resistance V1
Chỉ báo
2 lượt mua
Phiên bản 1.0, Nov 2025
Windows, Mac
5.0
Đánh giá: 1
Mô tả
Nếu bạn giao dịch dựa trên cấu trúc thị trường, bạn biết rằng các mức quan trọng nhất thường được thiết lập trên khung thời gian cao hơn. Chỉ báo tùy chỉnh này giải quyết sự khó chịu khi phải xác định và theo dõi các mức đó bằng tay.
Công cụ này được thiết kế để cung cấp một hệ thống phân cấp trực quan đáng tin cậy, đảm bảo bạn có thể nhìn thấy các ranh giới cấu trúc quan trọng và ưu tiên các vùng giá trị cao mà không cần rời khỏi màn hình thực thi của mình.
Các Tính Năng Chính & Kiểm Soát Chi Tiết
- Chỉ báo được xây dựng để có hiệu suất xuất sắc và hình ảnh biểu đồ sạch sẽ:
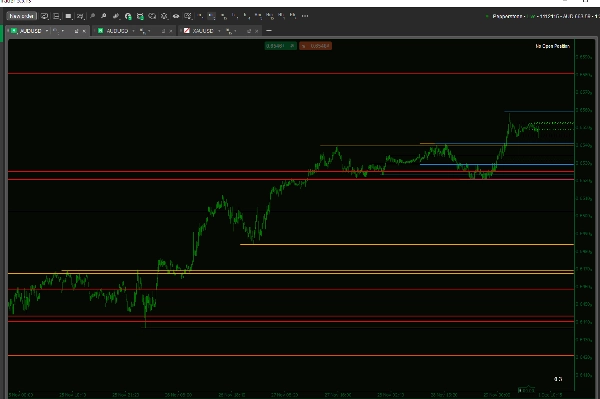
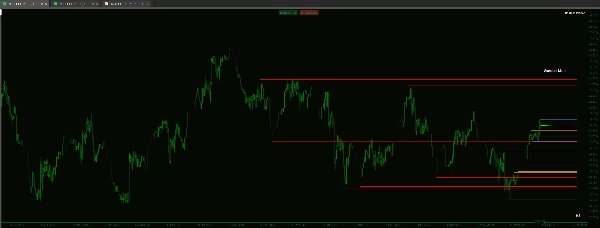
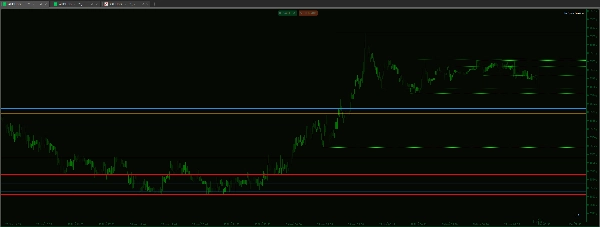
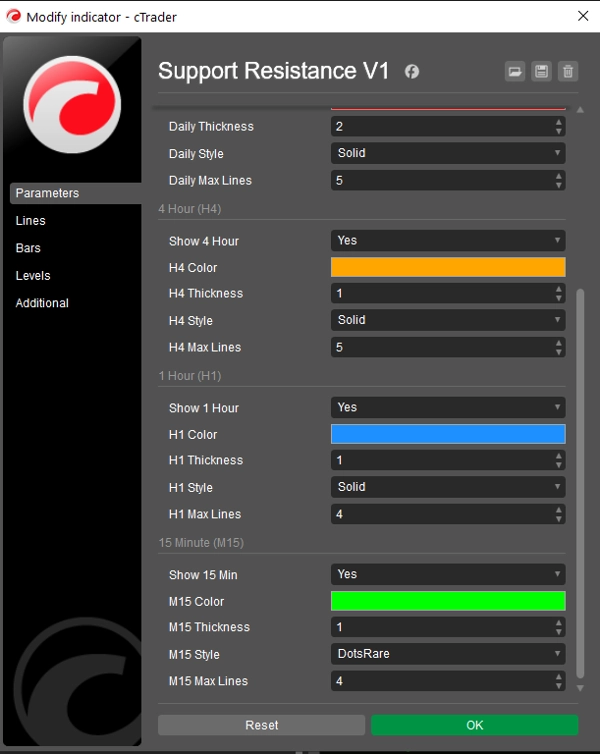
- Hệ Thống Phân Cấp Trực Quan Thực Sự: Kiểm soát độc lập độ dày, kiểu đường (Đặc, Gạch, Chấm), và màu sắc cho từng khung thời gian riêng biệt.
- Lợi Ích: Nhận biết ngay sức mạnh của một mức chỉ qua hình thức của nó (ví dụ, đặt các đường D1 dày/đặc cho cấu trúc chính và các đường H1 mỏng/chấm cho các mức ngay lập tức).
- Kiểm Soát Hiệu Suất & Tập Trung: Mệt mỏi với biểu đồ lộn xộn? Bạn có thể giới hạn Số Lượng Đường Tối Đa hiển thị cho từng khung thời gian riêng biệt.
- Ví dụ: Đặt H4 Max Lines là 5 và D1 Max Lines là 15 để ưu tiên các mức gần đây trên các khung thời gian thấp hơn trong khi vẫn duy trì cái nhìn sâu hơn về các cấu trúc chính.
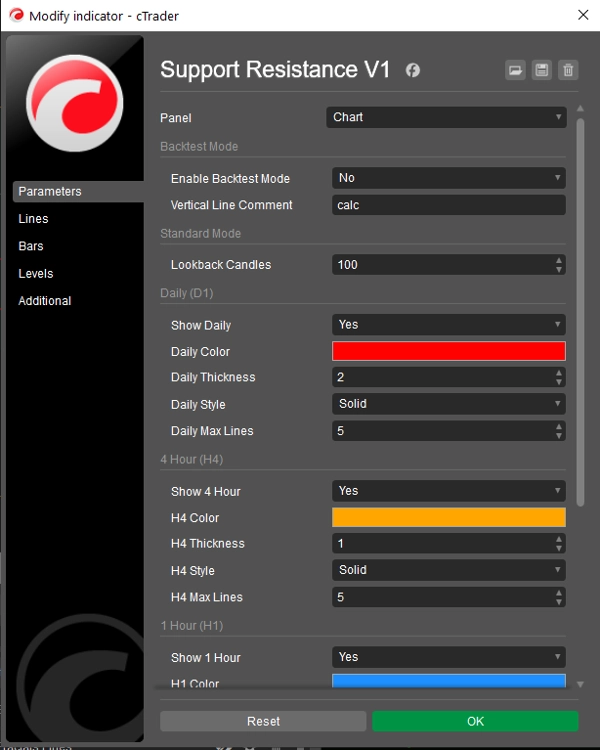
- Nền Tảng Mã Sạch: Xây dựng trên logic fractal đáng tin cậy, đảm bảo các mức được xác định là các điểm pivot cao/thấp thực sự được sử dụng trong phân tích cấu trúc tiêu chuẩn.
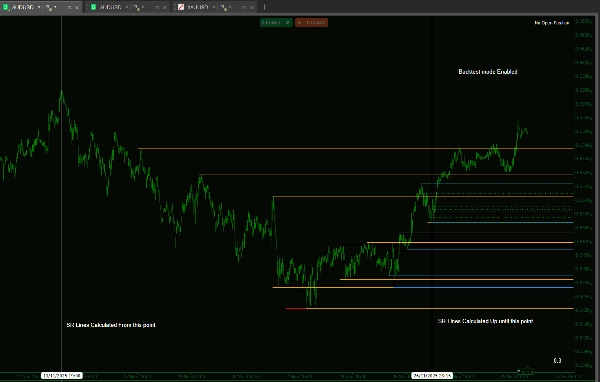
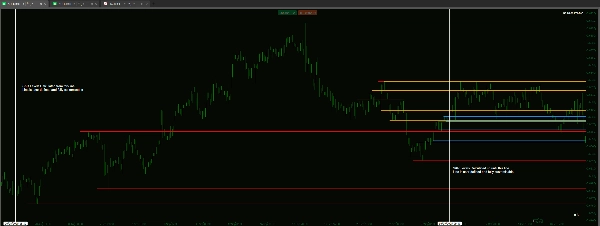
- Chế Độ Backtesting Riêng Biệt: Bao gồm chức năng giới hạn phân tích của chỉ báo trong một khoảng thời gian xác định trên biểu đồ. Điều này rất cần thiết cho việc backtesting thủ công chính xác bằng cách mô phỏng tiến trình thời gian mà không bị thiên vị tương lai.
Tóm tắt
Tóm tắt AI
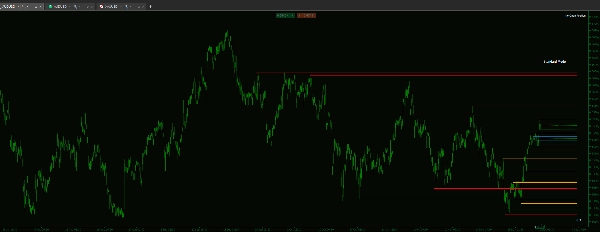
Frac Support Resistance V1 is a technical indicator designed to automatically calculate and display smart support and resistance lines derived from multiple timeframes: daily (D1), 4-hour (H4), hourly (H1), and 15-minute (M15). It assists traders who rely on market structure by visually highlighting critical price levels established on higher timeframes, reducing the need for manual identification.
Key features include customizable visual hierarchy, allowing independent adjustment of line thickness, style (solid, dashed, dotted), and color for each timeframe. This enables quick recognition of the relative strength of support and resistance levels. Users can also control chart clarity by setting maximum numbers of lines per timeframe to prioritize recent or major structural levels.
The indicator is based on fractal logic to identify genuine high and low pivots consistent with standard market structure analysis. It includes a dedicated backtesting mode that restricts analysis to a specified historical period, facilitating unbiased manual strategy testing by simulating real-time progression.
Frac Support Resistance V1 supports various markets including Forex, cryptocurrencies, commodities, indices, and stocks, with tags indicating compatibility with symbols like BTCUSD, EURUSD, GBPUSD, XAUUSD, NAS100, and USDJPY. The tool is suited for strategies involving breakout, scalping, smart money concepts, and grid trading.
Hồ sơ chỉ báo
Đánh giá của khách hàng
5.0
Đánh giá: 1
5 | 100 % | |
4 | 0 % | |
3 | 0 % | |
2 | 0 % | |
1 | 0 % |
Đánh giá của khách hàng
December 1, 2025
A small account test feels safer, and the plan becomes easier to stick with, and the chart still needs a final look.
Thảo luận
Câu hỏi thường gặp
BTCUSD
Forex
Signal
Breakout
Indices
EURUSD
Commodities
GBPUSD
NZDUSD
Prop
Scalping
SMC
Crypto
Grid
Stocks
AI
XAUUSD
NAS100
USDJPY
Các sản phẩm có sẵn trên cTrader Store, bao gồm bot giao dịch, chỉ báo và plugin, được cung cấp bởi các nhà phát triển bên thứ ba và chỉ nhằm mục đích cung cấp thông tin và tiếp cận kỹ thuật. cTrader Store không phải là nhà môi giới và không cung cấp lời khuyên đầu tư, khuyến nghị cá nhân hay bất kỳ đảm bảo nào về hiệu suất trong tương lai.


Giá
Kể từ 14/01/2025
55
Lượt bán
11.5K
Cài đặt miễn phí