
Mô tả
Mở khóa sự hiểu biết sâu sắc hơn về động lực thị trường Forex với chỉ báo Relative Currency Strength (RCS) toàn diện, được thiết kế đặc biệt cho nền tảng cTrader.
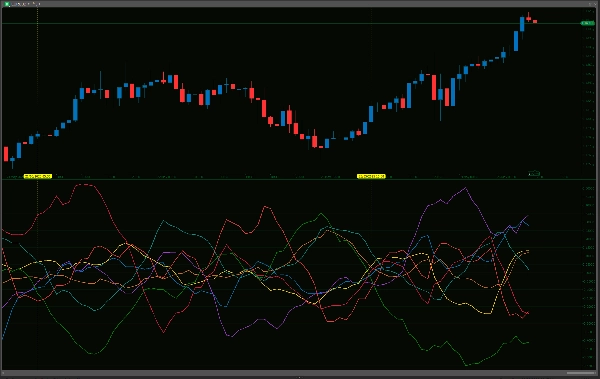
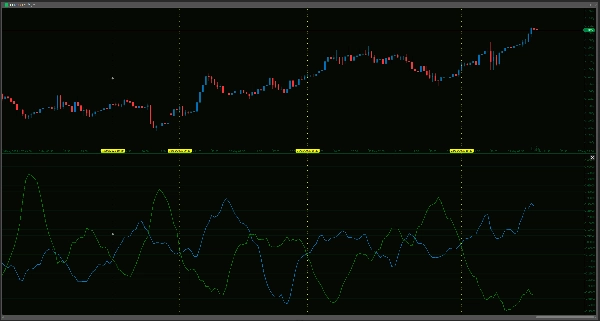
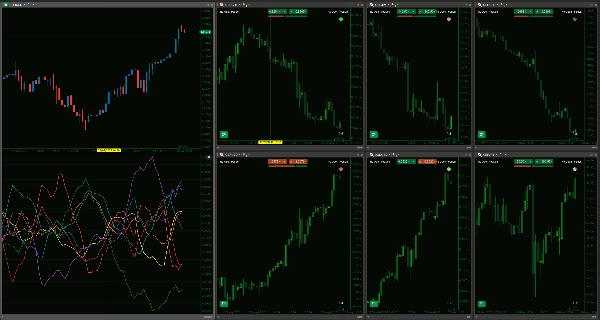
Công cụ mạnh mẽ này đánh giá kỹ lưỡng hiệu suất riêng lẻ của tám đồng tiền chính—AUD, USD, EUR, JPY, GBP, CAD, CHF và NZD—bằng cách phân tích sự thay đổi phần trăm của chúng so với nhau trong một giỏ gồm 28 cặp tiền tệ. Với các khoảng thời gian lookback và làm mượt do người dùng định nghĩa, bạn có thể điều chỉnh độ nhạy của chỉ báo để phù hợp với phương pháp giao dịch độc đáo của mình, từ scalping nhanh đến các chiến lược dài hạn. Kết quả hiển thị rõ ràng cho phép so sánh ngay lập tức, giúp bạn nhanh chóng xác định các đồng tiền thể hiện động lực tăng mạnh hoặc những đồng tiền có dấu hiệu yếu đi, điều này có thể rất hữu ích trong việc chọn các cặp tiền tệ có tiềm năng cao hơn cho các chiến lược của bạn. Nó cung cấp một cách để vượt ra ngoài phân tích từng cặp đơn lẻ và nhìn thấy bức tranh lớn hơn về những đồng tiền riêng lẻ thực sự đang thúc đẩy các chuyển động thị trường.
Tuy nhiên, điều quan trọng là sử dụng chỉ báo này với sự hiểu biết rõ ràng về khả năng và giới hạn của nó. Chỉ báo RCS là một công cụ phân tích tinh vi, không phải là một thiết bị dự báo không thể sai lầm hay một hệ thống giao dịch 'đặt và quên' hoàn chỉnh. Các phép tính của nó dựa trên dữ liệu giá lịch sử và nhằm mục đích bổ trợ, không thay thế, phương pháp giao dịch đã được thiết lập của bạn, vốn luôn bao gồm phân tích hành động giá kỹ lưỡng, xem xét các yếu tố cơ bản và thực hành quản lý rủi ro vững chắc. Mặc dù các đường biểu thị 'sức mạnh' hoặc 'yếu đuối', các chỉ số này cần được giải thích cẩn thận trong bối cảnh thị trường rộng lớn hơn; ví dụ, một đồng tiền thể hiện 'sức mạnh' cực đoan có thể đang tiến gần đến trạng thái mua quá mức hoặc mức kháng cự quan trọng.
Hiệu suất của chỉ báo cũng có thể dao động theo điều kiện thị trường hiện hành (ví dụ, nó có thể hoạt động khác trong thị trường có xu hướng mạnh so với thị trường đi ngang, biến động), và độ chính xác của nó phụ thuộc vào việc nền tảng của bạn có đủ dữ liệu lịch sử sạch cho tất cả 28 cặp tiền tệ liên quan hay không. Mặc dù được tối ưu hóa cho các phép tính liên tục, việc tải dữ liệu ban đầu cho một phân tích đa tiền tệ toàn diện như vậy có thể đòi hỏi nhiều tài nguyên nền tảng, đặc biệt là trên các kết nối chậm hoặc phần cứng kém mạnh. Bằng cách cung cấp một góc nhìn đa tiền tệ tinh tế, chỉ báo RCS này được cung cấp như một công cụ hỗ trợ quý giá giúp bạn đưa ra các quyết định giao dịch có thông tin hơn, chiến lược hơn và có thể nâng cao lợi thế của bạn trong thị trường Forex cạnh tranh, thay vì là một giải pháp độc lập.
Vui lòng kiểm tra xem nhà môi giới của bạn có cung cấp tất cả các cặp chéo trong chỉ báo này để nó hoạt động.
--------------------------
Xin vui lòng xem thêm các chỉ báo khác của tôi!
https://ctrader.com/products/1181
https://ctrader.com/products/1182
https://ctrader.com/products/1180
https://ctrader.com/products/1015
https://ctrader.com/products/555
https://ctrader.com/products/553
https://ctrader.com/products/554
https://ctrader.com/products/552
https://ctrader.com/products/557
https://ctrader.com/products/845
https://ctrader.com/products/848
https://ctrader.com/products/847
https://ctrader.com/products/846
https://ctrader.com/products/551
https://ctrader.com/products/574
https://ctrader.com/products/573
https://ctrader.com/products/556
https://ctrader.com/products/558
https://ctrader.com/products/559
https://ctrader.com/products/560
Tóm tắt
The indicator provides a clear visual representation of currency strength and weakness, enabling traders to identify currencies with strong momentum or signs of weakness at a glance. This multi-currency perspective helps move beyond single-pair analysis to understand which currencies are driving market movements.
The tool relies on historical price data and requires all relevant currency pairs to be available from the broker. Its performance may vary with market conditions, and it is intended to complement, not replace, comprehensive trading strategies that include price action, fundamental analysis, and risk management. Initial data loading can be resource-intensive due to the breadth of cross-currency calculations.
This indicator serves as an analytical aid to support more informed Forex trading decisions by highlighting relative currency strength across major pairs.
Đánh giá của khách hàng
5 | 33 % | |
4 | 67 % | |
3 | 0 % | |
2 | 0 % | |
1 | 0 % |


![Logo "[Stellar Strategies] Market Session Ultimate"](https://cdn.ctrader.com/image/webp/61ffd537-0125-4246-9e72-42eca1791d64_28232)


