
Description
HIO Inside Bar Scanner Standard : Ne manquez jamais une configuration sur cTrader !
1. Introduction
Ne manquez plus jamais une opportunité de trading avec le HIOInsideBarScanner ! Cet assistant ultime pour cTrader analyse tout le marché pour découvrir des configurations Inside Bar à haute probabilité. Arrêtez de parcourir manuellement les graphiques — laissez le système faire le travail lourd pour vous !
2. Fonctionnalités clés
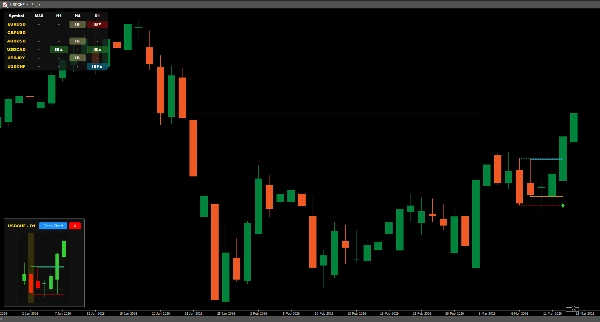
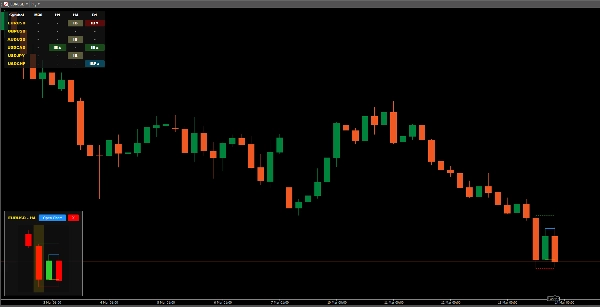
- Tableau de bord tout-en-un : Surveillez des dizaines de paires et de périodes via une grille élégante unique.
- Détection précise des cassures : Recevez des alertes instantanées lorsque le prix casse une Inside Bar ou une Mother Bar, avec détection des faux signaux.
- Popup mini-graphique intelligent : Cliquez pour voir instantanément un mini graphique du signal, vous faisant gagner un temps précieux d’analyse.
3. Guide de configuration & décomposition des paramètres
Cet indicateur est conçu pour être 100 % adapté à votre stratégie. Voici comment affiner votre machine de scan ultime :
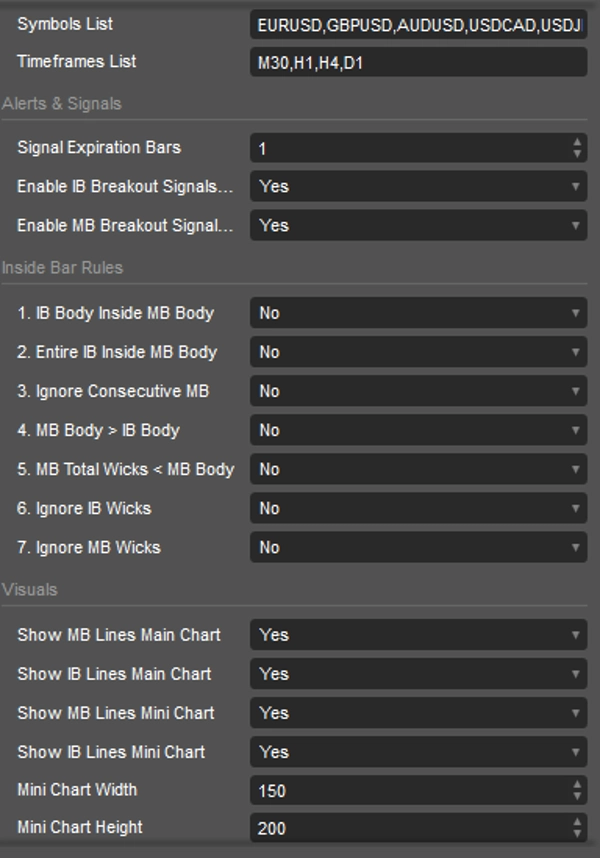
- Paramètres généraux :
-
- Liste des symboles : Saisissez vos paires de devises cibles (ex. : EURUSD, GBPUSD, AUDUSD), séparées par des virgules. Analysez-les toutes simultanément !
- Liste des périodes : Définissez votre approche en saisissant vos périodes préférées (ex. : H1, H4, D1). Supporte tout, du M1 pour les scalpers au MN1 pour les swing traders long terme.
- Alertes & Signaux :
-
- Expiration des barres de signal : Définissez combien de barres un signal de cassure reste valide (Par défaut : 1). Évitez les entrées tardives lorsque l’élan est perdu !
- Activer les signaux de cassure IB (IBI/IBIF) : Activez ceci pour recevoir des alertes lorsque le prix casse les limites de l’Inside Bar (inclut la détection des faux signaux).
- Activer les signaux de cassure MB (IB/IBF) : Activez les alertes pour les vraies cassures de Mother Bar — une forte confirmation de continuation ou de renversement de tendance.
- Règles intelligentes pour Inside Bar :
-
- Corps IB à l’intérieur du corps MB : Filtre strict exigeant que le corps de l’Inside Bar soit entièrement contenu dans le corps de la Mother Bar.
- Inside Bar entière à l’intérieur du corps MB : La règle la plus stricte — toute l’Inside Bar (mèches incluses) doit tenir à l’intérieur du corps de la Mother Bar.
- Ignorer les MB consécutives : Ignore les Mother Bars consécutives pour vous aider à vous concentrer uniquement sur les configurations de cassure initiales et fraîches.
- Corps MB > Corps IB : Assure que le corps de la Mother Bar est plus grand que celui de l’Inside Bar, filtrant les formations faibles.
- Mèches totales MB < Corps MB : Filtre les Mother Bars désordonnées en s’assurant que la taille totale des mèches est inférieure au corps. Dites adieu au bruit du marché !
- Ignorer les mèches IB/MB : Force le scanner à calculer les cassures uniquement sur les prix d’ouverture/fermeture des chandeliers plutôt que sur les mèches hautes/basses.
- Visuels :
-
- Afficher les lignes MB/IB sur le graphique principal : Trace automatiquement des lignes de délimitation claires pour les MB et IB directement sur votre graphique principal.
- Paramètres du mini graphique : Activez ou désactivez les lignes de délimitation sur votre mini-graphique popup et ajustez la largeur/hauteur pour un affichage parfait sur votre écran.
4. Guide des symboles du tableau de bord : Lisez le marché en un coup d’œil
Le tableau de bord HIOInsideBarScanner utilise des symboles intuitifs pour vous aider à comprendre instantanément l’action des prix en cours :
- IB : Une nouvelle Inside Bar s’est formée. (Préparez-vous à une cassure potentielle !)
- IBI▲ : Le prix a clôturé au-dessus du plus haut de l’Inside Bar. (Cassure haussière précoce)
- IBI▼ : Le prix a clôturé en dessous du plus bas de l’Inside Bar. (Cassure baissière précoce)
- IBIF▲ : Le prix a cassé en dessous du plus bas de la Mother Bar, puis est revenu clôturer au-dessus du plus haut de l’Inside Bar. (Faux signal baissier - Excellente opportunité d’achat)
- IBIF▼ : Le prix a cassé au-dessus du plus haut de la Mother Bar, puis est revenu clôturer en dessous du plus bas de l’Inside Bar. (Faux signal haussier - Excellente opportunité de vente)
- IB▲ : Le prix a clôturé au-dessus du plus haut de la Mother Bar. (Confirmation forte de cassure haussière)
- IB▼ : Le prix a clôturé en dessous du plus bas de la Mother Bar. (Confirmation forte de cassure baissière)
- IBF▲ : Le prix a cassé en dessous du plus bas de la Mother Bar, puis a violemment rebondi pour clôturer au-dessus du plus haut de la Mother Bar. (Piège à l’ours majeur)
- IBF▼ : Le prix a cassé au-dessus du plus haut de la Mother Bar, puis a violemment rebondi pour clôturer en dessous du plus bas de la Mother Bar. (Piège au taureau majeur)
Résumé
Key functionalities include real-time alerts for breakouts of Inside Bars and Mother Bars, with built-in fakeout detection to enhance signal reliability. Users can customize symbol and timeframe lists, set signal expiration periods, and toggle specific breakout alerts. The indicator applies strict filtering rules based on candle body and wick relationships to refine pattern recognition and reduce noise.
A smart mini-chart popup allows quick visual analysis of signals without switching charts. Visual boundary lines for Inside Bars and Mother Bars can be displayed on the main chart and mini-chart for clarity. The dashboard uses intuitive symbols to convey the status of price action, such as new Inside Bars, bullish or bearish breakouts, and fakeout scenarios.
This tool supports a range of trading styles from scalping to long-term strategies by accommodating timeframes from one minute to monthly charts. It is adaptable to user strategies through detailed parameter settings, facilitating tailored market scanning and breakout detection.
Avis clients
5 | 100 % | |
4 | 0 % | |
3 | 0 % | |
2 | 0 % | |
1 | 0 % |


