
Description
indicateur qui colore les chandeliers en temps réel en fonction de la structure du marché et trace des zones de liquidité, des flux institutionnels et des plages de consolidation. Conçu pour les traders qui opèrent selon les Smart Money Concepts (SMC) principes.
🧠 Logique de l'algorithme
https://chartshots.spotware.com/c/69f0e3fd81319
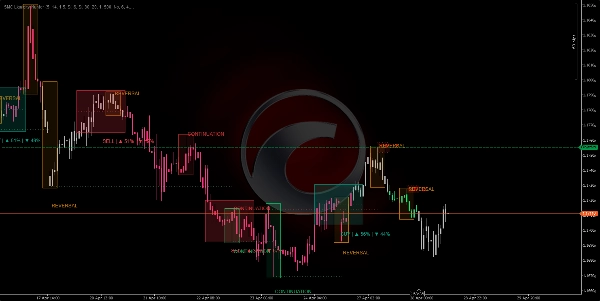
1. Détection de la structure du marché 🔍
- Trouve les pivots (hauts et bas locaux) en utilisant une période de retour configurable.
- Compare les pivots consécutifs pour déterminer la structure :
-
- Hauts plus hauts + Bas plus hauts = Biais haussier 📈
- Hauts plus bas + Bas plus bas = Biais baissier 📉
- Signaux mixtes = Biais neutre ➡️
- Filtre le bruit : ne compte que les pivots qui dépassent un seuil basé sur l'ATR (Average True Range) multiplié par une sensibilité ajustable.
https://chartshots.spotware.com/c/69f0e7e752b74
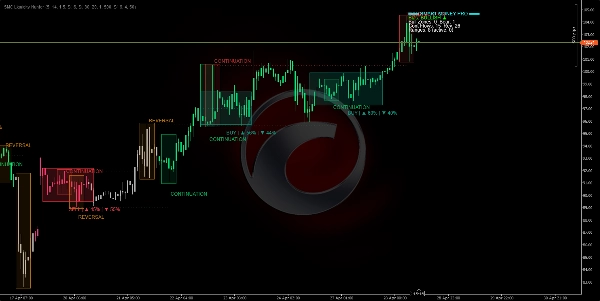
2. Flux institutionnels (Boîtes de flux) 🔄
- Chaque fois qu'un nouveau pivot significatif se forme, l'algorithme trace une ligne horizontale du pivot précédent au nouveau.
- Classe le flux comme :
-
- Continuation : le prix respecte la tendance (HL en tendance haussière, LH en tendance baissière) ✅
- Renversement : le prix casse la structure (LL en tendance haussière, HH en tendance baissière) ⚠️
- Trace une boîte colorée autour du pivot étiqueté "CONTINUATION" ou "REVERSAL".
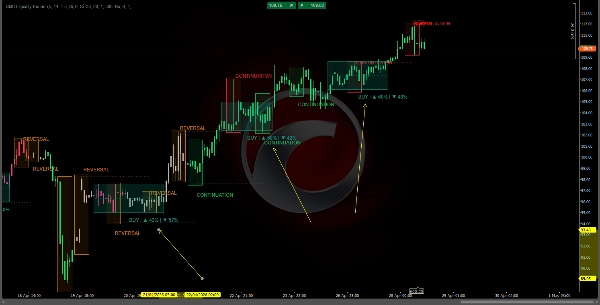
3. Zones d'offre/demande (Liquidité) 💧
https://chartshots.spotware.com/c/69f0e8e7aef29
- Autour de chaque pivot significatif, une bande horizontale est tracée s'étendant dans le futur pour un nombre configurable de barres.
- Ces zones représentent des ordres institutionnels non exécutés :
-
- Pivots baissiers → zone d'OFFRE (ordres de vente) 🔴
- Pivots haussiers → zone de DEMANDE (ordres d'achat) 🟢
- Une zone se casse et disparaît lorsque le prix la pénètre avec suffisamment de force ou lorsque sa durée de vie expire.
4. Moteur de détection de plage (Consolidations) 📦
- Calcule une Moyenne Mobile Simple (SMA) avec une bande ATR autour.
- Si chaque barre dans une fenêtre de retour reste à l'intérieur de la bande, l'algorithme identifie une plage de consolidation.
- Trace un rectangle bleu avec :
-
- Ligne médiane en pointillés (équilibre de la plage) ⚖️
- Pourcentage de probabilité de cassure haussière/baissière basé sur :
-
- Momentum directionnel (ADX/DI+ vs DI-) 📐
- Volume cumulatif haussier vs baissier à l'intérieur de la plage 📊
- Temps passé dans la moitié supérieure vs inférieure ⏱️
5. Coloration des chandeliers (Propre & Visuel) 🕯️
- Chandelier vert = structure haussière confirmée (HH+HL) 🟢
- Chandelier magenta/rouge = structure baissière confirmée (LH+LL) 🔴
- Chandelier gris = phase neutre ou de transition ⚪
- Pas de rectangles superposés : les mèches et corps réels sont toujours entièrement visibles.
📋 Tableau de bord (coin)
Résumé numérique des zones actives, flux & plages
🛠️ Comment l'utiliser
⚙️ Paramètres recommandés
- Période : H1 ou plus (idéal pour Smart Money).
- Paramètres par défaut : fonctionnent bien pour le Forex, les indices et la crypto.
- Ajuster la sensibilité : augmentez pour les marchés volatils, diminuez pour les marchés latéraux agités.
📗 Règles de trading :
✅ Entrée Longue (ACHAT)
- Les chandeliers doivent être verts (biais haussier actif) 🟢
- Le prix touche ou s'approche d'une zone "DEMANDE" active 🟢
- Une boîte "CONTINUATION" (pas "REVERSAL") apparaît à cette zone ✅
- Le tableau de bord affiche une probabilité de cassure haussière > 60% sur la plage active (le cas échéant) 📊
✅ Entrée Courte (VENTE)
- Les chandeliers doivent être magenta/rouges (biais baissier actif) 🔴
- Le prix touche ou s'approche d'une zone "OFFRE" active 🔴
- Une boîte "CONTINUATION" (pas "REVERSAL") apparaît à cette zone ✅
- Le tableau de bord affiche une probabilité de cassure baissière > 60% 📊
❌ Ne PAS trader si...
- Les chandeliers sont gris (pas de biais défini) ⚪
- Un signal "REVERSAL" apparaît juste là où vous étiez sur le point d'entrer ⚠️
- Le prix est à l'intérieur d'une plage bleue sans cassure claire pour le moment 🔵
- Le tableau de bord affiche une confluence opposée (confluence baissière sur une configuration haussière, ou vice versa) 🔄
📈 Interprétation du tableau de bord
text
═══ SMART MONEY PRO ═══
Biais : HAUSSIER ▲ ← Biais actuel du marché
Zones haussières : 2 Baissières : 1 ← Zones de liquidité actives
Flux cont : 3 Rev : 0 ← Continuations vs renversements
Plages : 4 (actives : 1) ← Total et plages actives
Plage active ▲65% ▼35% ← Probabilité de cassure
⚡ CONFLUENCE HAUSSIÈRE ← Signal d'alignement maximal
💡 Principes clés
- ✅ Pas de repaint : tout est calculé uniquement avec les données des barres fermées.
- ✅ Graphique propre : chandeliers réels colorés, zones semi-transparentes, pas d'encombrement visuel.
- ✅ Aperçu de la structure : la couleur du chandelier indique la phase du marché avant que les pivots ne soient évidents.
- ✅ Confluence intégrée : lorsque zone active + plage active + signal de flux s'alignent, le tableau de bord le signale explicitement.
Résumé
Key features include:
- **Institutional Flows:** Draws horizontal lines and colored boxes between significant pivots, labeling flows as "CONTINUATION" or "REVERSAL" to indicate trend respect or break.
- **Supply and Demand Zones:** Highlights unexecuted institutional orders with horizontal bands around pivots, distinguishing supply (sell) and demand (buy) zones that expire or break upon price penetration.
- **Range Detection:** Identifies consolidation ranges using an SMA with ATR bands, marking them with blue rectangles and providing breakout probability percentages based on momentum, volume, and time distribution.
- **Dashboard:** Displays numeric summaries of active zones, flows, ranges, and breakout probabilities, including confluence signals when multiple factors align.
Recommended for use on H1 or higher timeframes, the indicator suits Forex, indices, and cryptocurrencies. It operates without repainting by relying on closed bar data and maintains a clean chart presentation with visible candle wicks and bodies.
Avis clients
5 | 50 % | |
4 | 0 % | |
3 | 0 % | |
2 | 50 % | |
1 | 0 % |


