
Description
🚀 Plus de 10 000 traders utilisent déjà nos indicateurs TOP🏆
Découvrez pourquoi les professionnels nous choisissent – les outils les plus puissants sur cTrader (indicateurs, algorithmes et cBots) vous attendent.
👉 Obtenez tous nos systèmes TOP ici :
_______________________________________________
_______________________________________________
📌 Indicateurs de Structure de Marché
· 🔄 Analyse Dynamique de la Structure de Marché des Points de Renversement
· 🧱 Order Block
· ⛓️ BOS & CHOCH
· 🧠 ICT Power of 3
· 🌀 Zones de Polarité du Marché
______________________________________________________________-
Boutique cBots : 🧠 Gold & BTC BreakoutSession Pivots 🧠
_______________________________________________
🔚 Systèmes de Sortie Intelligents
· 📍 Algorithme Intelligent de Trailing
_______________________________________________
📐 Indicateurs ZigZag
· 🔍 Projection de Liquidité des Prix ZigZag
· ➖ ZigZag
· 🎯 Traceur d'Extrémités Zig-Zag
_______________________________________________
🧱 Indicateurs de Support & Résistance
· 🟩 Lignes de Support & Résistance SmartTrend
· 🧱 Tous les Niveaux de Support et Résistance
_______________________________________________
📊 Indicateurs de Tendance & Canal
· 🔄 Canal de Tendance Automatique
· 📊 Supertrend
· ⚡Analyseur de Tendance Momentum
· 🧠 Canal de Tendance Adaptatif
· 💥 Système de Rupture de Canal
· 🌈 Gradient de Tendance Dynamique
_______________________________________________
💧 Outils de Volume & Liquidité
· 🔥 Carte Thermique Volume POC
· 📉 Carte de Liquidation à Effet de Levier
· 🕒 Sessions de Fair Value Gap
_______________________________________________
⚡ Indicateurs Momentum & RSI
· 📈 Déclencheur de Tendance RSI
· 🚀 Momentum de Plage Dynamique
· 🔎 Traceur de Biais Multi-Niveaux de Chandeliers
_______________________________________________
🔮 Outils de Prédiction & Projection
· 📐 Prédiction Basée sur Linreg & ATR
· 📏 Régression Linéaire Fibonacci Multi-échelle
· 📈 Projecteur de Flux de Marché Alimenté par le Volume
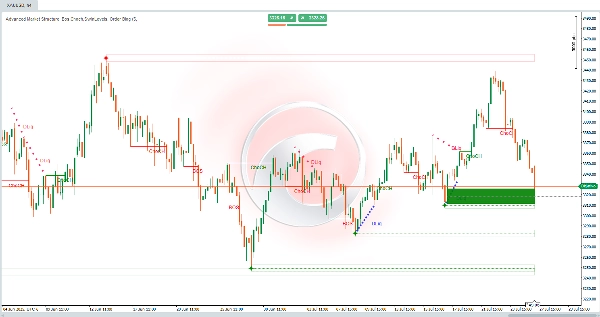
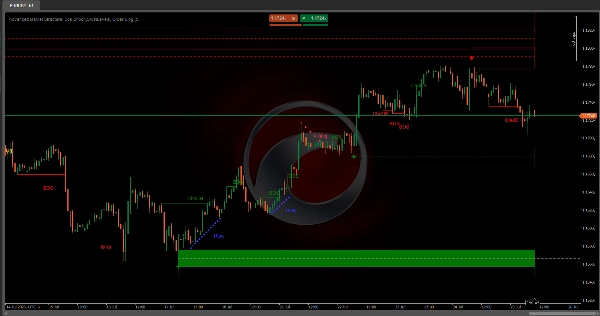
Advanced Market Structure : Bos, Choch, SwinLevels, Order Blocks, Structure de Marché & Liquidity Finder.
Qu'est-ce que c'est ?
Un outil avancé d'action des prix qui combine plusieurs concepts d'analyse technique en un indicateur puissant. Intègre :
- 📊 Structure de Marché
- 🔄 Niveaux de Swing
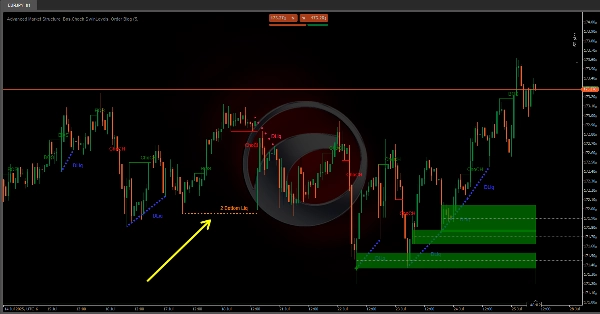
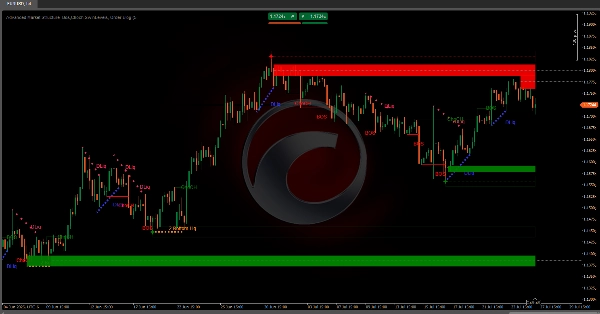
- 🧱 Order Blocks
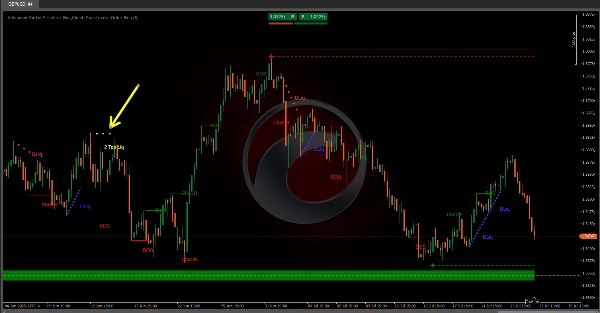
- 💧 Liquidity Finder (2 creux & 2 sommets)
Objectif : Identifier les points clés d'entrée/sortie, les tendances, les supports/résistances et les zones institutionnelles où le prix réagit.
🧠 Philosophie Centrale : Smart Money
Les marchés sont dirigés par des acteurs institutionnels (banques, fonds, teneurs de marché) disposant de ressources supérieures. Ils créent des schémas pour :
- 🕵️♂️ Cacher les opérations lors de l'accumulation/la distribution.
- 🎯 Chasser la liquidité (stop loss des particuliers).
- 🚀 Alimenter des mouvements explosifs dans des marchés déséquilibrés.
🔑 Composants :
1. Order Blocks
- Quoi : Zones où les institutions ont exécuté des ordres massifs, créant des déséquilibres.
- Types :
-
- 🟢 Haussier (Demande) : Achat institutionnel agressif.
- 🔴 Baissier (Offre) : Vente institutionnelle agressive.
- Signal Clé : Rebond/inversion du prix aux order blocks.
- Détection :
-
- Pics de volume près des plus hauts (baissier) ou des plus bas (haussier).
2. Niveaux de Swing
- But : Définir la structure du marché via les plus hauts/bas clés.
- Ruptures Critiques :
-
- 🔺 Rupture de Swing Haut : Continuation haussière.
- 🔻 Rupture de Swing Bas : Continuation baissière.
3. Rupture de Structure (BoS)
- Définition : Rupture décisive des plus hauts (haussier) ou des plus bas (baissier) de swing.
- Connexion Fractale :
-
- 🐂 Fractale Haussière : Motif de 5 chandeliers avec le creux central le plus bas.
- 🐻 Fractale Baissière : Motif de 5 chandeliers avec le sommet central le plus haut.
4. Changement de Caractère (ChoCh)
- Définition : Changement structurel signalant un renversement de tendance.
- Déclencheurs :
-
- Rupture des swing bas dans les tendances haussières (ChoCh baissier).
- Rupture des swing hauts dans les tendances baissières (ChoCh haussier).
5. Zones de Liquidité
- Types :
-
- ⚖️ Statique : Niveaux horizontaux avec hauts/bas groupés (filtrés par ATR).
- 🏃 Dynamique : Lignes de tendance reliant des pivots abrupts.
- Motifs Clés :
-
- 🕯️ 2 Sommets/2 Creux : Chasses aux stops institutionnelles.
- ⛰️ Triples Sommets/Creux : Zones de forte congestion.
🎯 Applications Clés
- ✅ Identifier les tendances/renversements via BoS/ChoCh.
- 📍 Localiser les supports/résistances en utilisant les niveaux de swing et les zones de liquidité.
- 🏦 Repérer les order blocks institutionnels.
- 🎯 Prédire les objectifs de prix via les zones de liquidité.
🔄 Stratégies Smart Money
PhaseSignauxAction Institutionnelle
1. Accumulation
ChoCh haussier + Order block de demande 📈
Smart Money achète
2. Markup
BoS consécutifs + gaps FVG 🚀
Le retail alimente le momentum
3. Distribution
ChoCh baissier au niveau de liquidité 2 Top 🎯
Smart Money vend
4. Markdown
BoS baissier + liquidation zone discount 🔻
Chasses aux stops aux creux
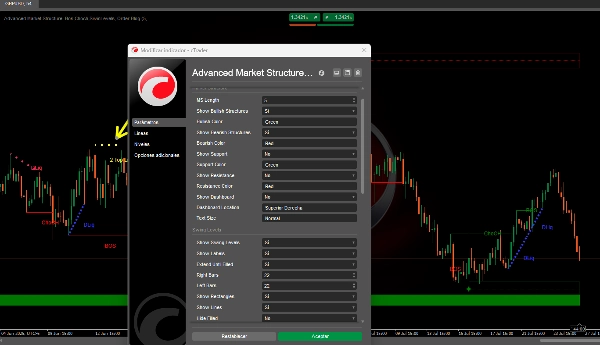
⚙️ Guide de Réglage des Paramètres
Structure de Marché
Longueur MS:-
- ⬆️ Augmenter : Moins de fractales mais plus fiables.
- ⬇️ Diminuer : Plus sensible (risque de bruit).
Niveaux de Swing
Taille Swing L/R:-
- ⬆️ Augmenter : Identifie les swings significatifs.
- ⬇️ Diminuer : Capture les retournements mineurs.
Étendre Jusqu'à Remplissage:-
- ✅ Activé : Les niveaux persistent jusqu'à ce que le prix les atteigne.
Order Blocks
Méthode de Mitigation:-
- ✨
Mèche: Signaux plus rapides (touche la mèche). - 🎯
Clôture: Signaux plus forts (clôture en dehors du bloc).
- ✨
Liquidity Finder
Sensibilité Statique/Dynamique:-
- ⬆️ Augmenter : Moins de zones (qualité supérieure).
- ⬇️ Diminuer : Plus de zones (sensibilité accrue).
Résumé
Key components include:
- **Order Blocks:** Zones of significant institutional buying (bullish) or selling (bearish) identified by volume spikes near highs or lows, signaling potential price rebounds or reversals.
- **Swing Levels:** Critical highs and lows defining market structure, with breaks indicating bullish or bearish continuations.
- **Break of Structure (BoS):** Decisive breaks of swing highs or lows, linked to fractal patterns, signaling trend direction.
- **Change of Character (ChoCh):** Structural shifts indicating trend reversals, triggered by breaking swing lows in uptrends or swing highs in downtrends.
- **Liquidity Zones:** Static (horizontal levels with clustered highs/lows) and dynamic (trendlines connecting pivots) zones highlighting institutional stop hunts and congestion areas.
The indicator supports smart money concepts, reflecting institutional market behavior phases: Accumulation, Markup, Distribution, and Markdown. Parameter tuning options allow adjustment of sensitivity and signal strength for Market Structure, Swing Levels, Order Blocks, and Liquidity Finder components. This tool aims to enhance market analysis by revealing institutional activity and improving trade decision-making.
Avis clients
5 | 33 % | |
4 | 67 % | |
3 | 0 % | |
2 | 0 % | |
1 | 0 % |


