
Description
QX FrameForge est un tableau de bord superposé multi-échelles temporelles de l'état du marché pour cTrader. Il compresse ce qui se passe sur plusieurs échelles temporelles en un panneau rapide et lisible, afin que vous puissiez trader avec du contexte au lieu de deviner.
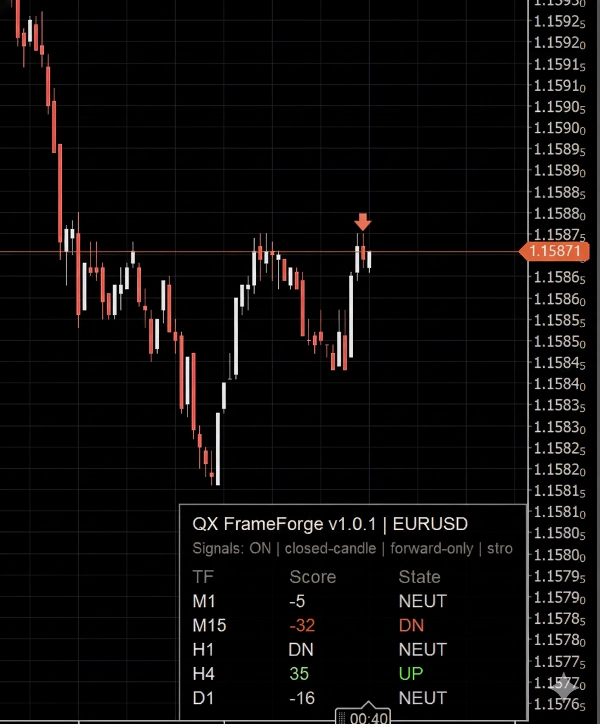
Pour chaque échelle temporelle sélectionnée, le panneau affiche :
- TF (échelle temporelle)
- Score (-100 à +100) pour exprimer la direction et la force
- État : HAUT / NEUTRE / BAS pour des décisions rapides
Des flèches optionnelles peuvent être activées pour marquer les confirmations en utilisant uniquement les chandeliers clôturés, ce qui maintient le graphique stable et évite le scintillement intrabarres.
Comment le lire (convivial pour les débutants)
Considérez le panneau comme un indicateur de direction :
- Score positif et HAUT signifient des conditions haussières sur cette échelle temporelle
- Score négatif et BAS signifient des conditions baissières sur cette échelle temporelle
- NEUTRE signifie que les conditions sont mixtes, en range, ou pas assez fortes pour être directionnelles
Un réglage de zone neutre contrôle la facilité avec laquelle l'indicateur bascule en NEUTRE. Une zone neutre plus large produit moins d'états directionnels (plus conservateur).
Ce qu'il y a dans le Score (niveau élevé)
Le Score combine :
- un composant tendance (direction et comportement de pente)
- un composant momentum (force de continuation vs hésitation)
- un filtre de volatilité optionnel pour réduire les périodes bruyantes
Le résultat est un score borné conçu pour l'alignement multi-échelles temporelles, pas pour des « entrées magiques ».
Comment les traders utilisent généralement FrameForge
1) Alignement multi-échelles temporelles
- Préférez les trades lorsque les échelles temporelles supérieures sont d'accord (exemple : H1 + H4 toutes deux HAUT)
- Utilisez une échelle temporelle inférieure (exemple : M5) pour le timing
2) Filtrage de régime
- Trop d'états NEUTRES signifie généralement du chop et des conditions de moindre qualité
- Une direction mixte des TF supérieurs suggère prudence ou exposition plus faible
3) Couche de confirmation
- Utilisez FrameForge pour confirmer que votre configuration est alignée avant de vous engager
Flèches optionnelles (signaux)
Les flèches sont une aide visuelle optionnelle. Elles sont évaluées uniquement sur la dernière bougie clôturée.
Vous pouvez choisir comment les flèches se déclenchent :
- uniquement lorsque la force dépasse un seuil,
- uniquement lorsque l'état directionnel change,
- ou plus fréquemment lorsque les conditions restent fortes.
Les contrôles incluent :
- seuil de force
- temps de recharge (barres minimales entre flèches)
- un signal par oscillation (réduit les flèches répétées dans la même direction)
- limite d'icônes (évite l'encombrement du graphique)
Important : les flèches sont conçues pour être uniquement prospectives à partir du moment où vous les activez, afin d'éviter le spam d'objets historiques et les visuels rétroactifs trompeurs.
Compatibilité
- Fonctionne sur tout symbole cTrader et toute échelle temporelle de graphique
- Indicateur uniquement. Aucune commande n'est passée.
- Mises à jour UI optimisées pour garder les graphiques réactifs.
Avertissement sur les risques
Le trading comporte des risques. Les performances passées ne garantissent pas les résultats futurs.
Résumé
The Score integrates trend direction and slope, momentum strength, and an optional volatility filter to reduce noise, producing a bounded metric aimed at multi-timeframe alignment rather than precise entry signals. Traders typically use FrameForge for aligning trades across timeframes (e.g., confirming higher timeframe trends before timing entries on lower timeframes), filtering market regimes by identifying choppy or mixed conditions, and adding a confirmation layer to their setups.
Arrow signals can be customized by strength thresholds, directional changes, cooldown periods, and icon limits to avoid chart clutter. The indicator works on any cTrader symbol and timeframe, updating efficiently to maintain chart responsiveness. It does not place orders and serves solely as a visual analytical tool.
Avis clients
5 | 100 % | |
4 | 0 % | |
3 | 0 % | |
2 | 0 % | |
1 | 0 % |


![Logo de "[Stellar Strategies] Inside Bar with Signals"](https://cdn.ctrader.com/image/webp/1d9e8bfa-3b2c-4440-bb37-5856902008a7_30683)
