Description
Indicateurs Pinescriptlabs Store : Pinescriptlabs Store cBots : (cBot) Gold & BTC BreakoutSession Pivots(nouveau)
PRICE ACTION (Nouveau)
Prédiction basée sur Linreg & ATR
SmartTrend Support &
Resistance
Lines
Analyse
de la structure
du marché
dynamique
des
points de retournement
Fibonacci
Régression
linéaire
Multi-échelle
Gradient de tendance dynamique
Multi-niveaux
Biais des chandeliers
Tracker
Support et
résistance automatiques
de tendance
Lignes
Tous les
niveaux de support
et de résistance
Niveaux
Momentum de la plage dynamique
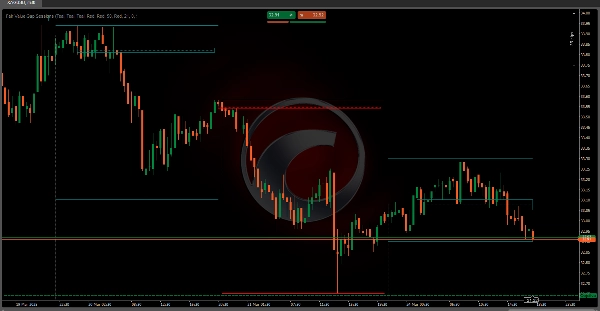
Sessions Fair Value Gap 📊💰
L'indicateur Fair Value Gap (FVG) est un outil de trading sophistiqué conçu pour identifier et mettre en évidence les inefficacités temporaires du marché appelées « écarts de juste valeur » 🚨 au sein de sessions de trading spécifiques. Ces écarts représentent des moments où le prix du marché évolue rapidement ⚡, créant un déséquilibre entre acheteurs et vendeurs.
Mécanismes techniques clés 🔧
Architecture basée sur la session 🕒
• Met en œuvre une approche d'analyse précise et configurable basée sur la session
• Permet aux traders de définir des heures de début de session personnalisées avec prise en charge du fuseau horaire UTC ou local 🌍
• Crée une limite de session dynamique qui se réinitialise et suit le comportement du marché 🔄
Logique de détection des écarts de juste valeur 🔎
• Utilise une analyse avancée de l'action des prix sur plusieurs barres de prix consécutives
• Identifie les écarts en comparant :
o Les prix hauts et bas des barres consécutives 📈📉
o Le prix de clôture de la barre précédente ✅
o La structure des prix de la barre actuelle 🔄
Classification des écarts 🏷️
L'indicateur distingue deux types principaux d'écarts :
- Écart de juste valeur haussier 📈
o Se produit lorsque le prix dépasse le plus haut précédent 🔺
o Indique un potentiel élan haussier du marché 🚀
o Signale une possible pression d'achat 💸 - Écart de juste valeur baissier 📉
o Se produit lorsque le prix descend en dessous du plus bas précédent 🔻
o Suggère un potentiel élan baissier du marché ⬇️
o Signale une possible pression de vente 🛑
Applications de trading 📱💼
Perspectives stratégiques 💡
• Aide les traders à visualiser les inefficacités du marché 🖼️
• Fournit un avertissement précoce des retournements de tendance potentiels ⚠️
• Offre une identification précise des points d'entrée et de sortie 🎯
Fonctions de gestion des risques 🛡️
• Visualisation codée par couleur des états d'écart 🎨
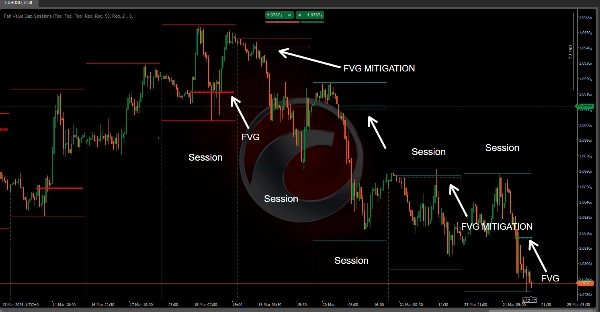
• Suit la "mitigation" de l'écart (lorsque le prix revient dans la zone d'écart) ↔️
• Permet des réglages de couleur personnalisables pour différentes conditions de marché 🎨
Visualisation technique 🎨
L'indicateur crée deux éléments visuels principaux :
- Rectangle de zone d'écart 🟩
o Représente la plage de prix de l'écart identifié 📐
o S'étend dynamiquement tout au long de la session de trading ➡️
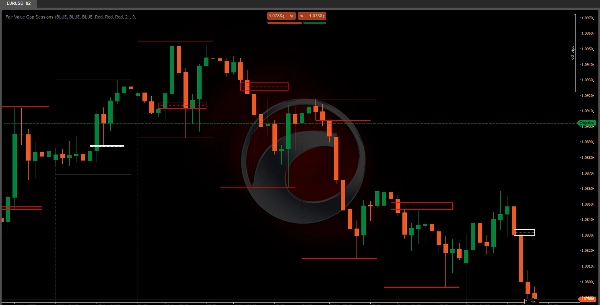
o Change de couleur en fonction de l'état de l'écart (actif/mitigé) 🟩➡️🟨 - Ligne de niveau 📏
o Positionnée au milieu de l'écart ⚫
o Aide les traders à identifier rapidement la zone de prix centrale de l'écart 📍
o Utilise différents styles de ligne pour indiquer l'état de l'écart ➔
Stratégies de trading pratiques 📝
Stratégies de signal d'entrée 🚦
• Utiliser la détection d'écart comme signal potentiel de continuation de tendance 🔄
• Rechercher le retour du prix vers l'écart (mitigation) comme confirmation ✅
• Combiner avec d'autres indicateurs techniques pour une prise de décision robuste 🤝
Techniques de gestion des risques 🛡️
• Placer un stop-loss près des limites de l'écart ⛔
• Utiliser le milieu de l'écart comme niveau potentiel de support/résistance 🪜
• Surveiller la mitigation de l'écart comme indicateur potentiel de retournement de tendance ↔️⚠️
Flexibilité de configuration ⚙️
• Heure de début de session personnalisable ⏰
• Configuration du fuseau horaire (UTC/Local) 🌍
En comprenant et en mettant correctement en œuvre l'indicateur Fair Value Gap Sessions, les traders peuvent acquérir une compréhension plus approfondie de la dynamique du marché, identifier des opportunités de trading potentielles et prendre des décisions plus éclairées basées sur les inefficacités de l'action des prix. 🧠📈
Résumé
It classifies gaps into two types: bullish gaps, indicating potential upward momentum and buying pressure, and bearish gaps, signaling possible downward momentum and selling pressure. Visually, it represents gaps with dynamic rectangles showing the price range and a midpoint level line to help traders quickly locate the gap's central price zone. Colors and line styles change to reflect the gap's active or mitigated status.
Traders can use this tool to visualize market inefficiencies, receive early warnings of trend reversals, and identify precise entry and exit points. Risk management features include color-coded gap states, tracking of gap mitigation when price returns to the gap zone, and customizable color settings. The indicator supports practical strategies such as using gap detection for trend continuation signals and combining it with other indicators for decision-making. Stop-loss placement near gap boundaries and monitoring gap mitigation for trend reversal are also supported.
Avis clients
5 | 100 % | |
4 | 0 % | |
3 | 0 % | |
2 | 0 % | |
1 | 0 % |