Description
VERSION MISE À JOUR DISPONIBLE — ICI
Une version mise à jour de cet indicateur a été publiée avec des corrections et améliorations critiques :
- Distribution du volume corrigée : allocation proportionnelle basée sur le chevauchement des chandeliers (au lieu de 100 % à tous les niveaux touchés)
- Détection VAH/VAL corrigée : la tolérance s'adapte désormais à la hauteur du niveau au lieu d'une valeur codée en dur
- Positionnement du texte corrigé : décalages dynamiques basés sur la période au lieu de jours codés en dur
- Paramètre de décalage de fuseau horaire : pour les profils DateTime
- Paramètre de position du texte : option de placement gauche/droite pour le mode lookback
- Améliorations des performances : recherche binaire pour la recherche DateTime, calculs de volume mis en cache, opérations de dictionnaire optimisées
__________________________________________________________________________________________
NOTES IMPORTANTES - LIRE EN PREMIER
Le volume Forex n'est pas un volume réel
Le volume en forex est un volume de ticks — il compte combien de fois le prix change. Il ne compte PAS combien d'argent a été échangé.
Ce que le volume de ticks ne peut pas montrer
- La taille des transactions. Une transaction de 100 $ et une de 10 000 000 $ comptent toutes deux comme 1 tick.
- Le flux d'argent réel. Vous ne pouvez pas voir si ce sont les gros ou petits investisseurs qui ont fait bouger le prix.
- La vraie liquidité. Vous ne pouvez pas voir combien d'ordres attendent sur le marché.
- L'activité bancaire. Les banques voient les données de volume réel. Vous ne les voyez pas.
Ce que cela signifie
Le volume de ticks montre seulement la fréquence des changements de prix — pas l'argent derrière. Cela crée des problèmes :
- Vous ne pouvez pas suivre les banques ou institutions. Elles utilisent des données de volume réel auxquelles vous n'avez pas accès.
- Vous ne pouvez pas prouver les théories du "smart money". Ces idées nécessitent le volume réel, pas le nombre de ticks.
- Vous ne pouvez pas juger la vraie liquidité. L'activité des ticks ne montre pas la profondeur des ordres ni la vraie force du marché.
- Vous ne pouvez pas mesurer la vraie puissance d'achat ou de vente. Beaucoup de petites transactions ressemblent à une grosse transaction institutionnelle.
- Les pics de volume peuvent être trompeurs. Un pic peut être juste un bruit algorithmique, pas un réel intérêt de trading.
Comment utiliser correctement cet indicateur
- Considérez-le comme un indicateur d'activité, pas un indicateur d'argent. Volume de ticks élevé = marché actif. Volume de ticks faible = marché calme. Rien de plus.
- Comparez l'activité entre différentes périodes. Utilisez-le pour voir : la session de Londres est-elle plus active que New York ? Aujourd'hui est-il plus actif qu'hier ? La période de tendance est-elle plus active que la consolidation ?
- Combinez-le avec la structure des prix. Utilisez support/résistance, points de swing, ou BOS/ChoCH avec le volume. Le contexte des prix évite les faux signaux dus aux pics de volume bruyants.
- Surveillez l'activité aux niveaux de prix importants. Quand le prix teste un niveau clé et que le volume de ticks augmente, cela signifie que plus de traders sont actifs. Cela ne signifie PAS que de gros acteurs sont impliqués.
- Ne supposez pas qu'il montre l'activité institutionnelle. Le volume de ticks ne peut pas montrer l'accumulation, les gros ordres, ou le "smart money". Utilisez-le uniquement pour mesurer le rythme et le tempo.
__________________________________________________________________________________________
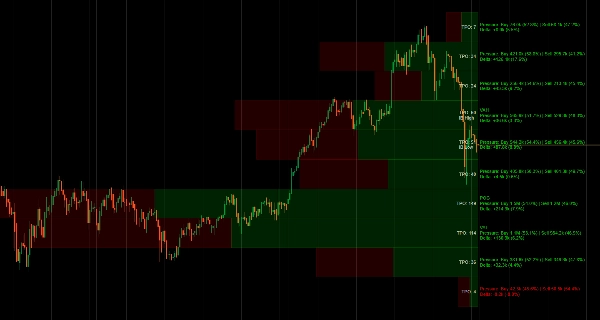
Visualisez la distribution du volume et le temps passé au prix avec le suivi POC, Zone de Valeur et Profil de Marché TPO.
Cet indicateur montre la distribution du volume en utilisant les concepts du Profil de Marché. Il affiche le Point de Contrôle (niveau d'activité de ticks le plus élevé), les limites de la Zone de Valeur (où la majorité des échanges ont eu lieu), les séquences de lettres TPO (temps passé à chaque prix), et une visualisation delta qui divise l'activité des ticks selon la direction des chandeliers.
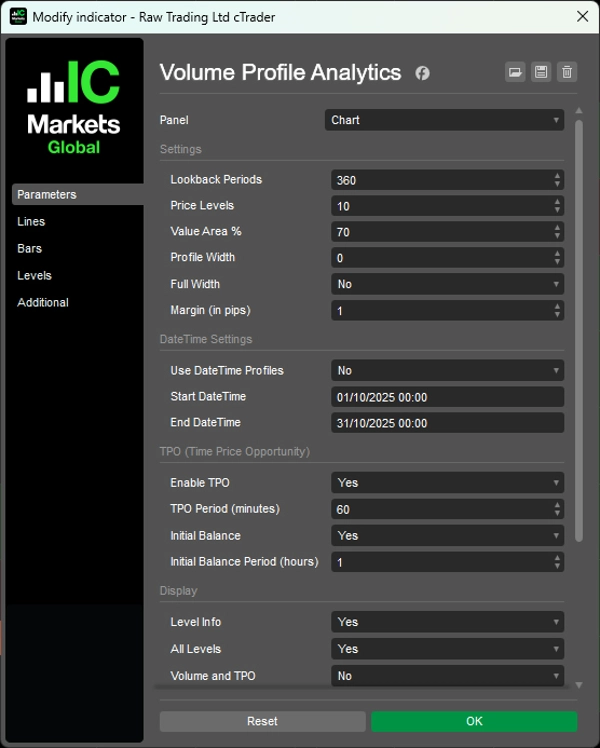
Vous pouvez choisir des périodes de retour en arrière ou définir des plages de dates spécifiques, afficher les barres de volume en proportionnel ou en pleine largeur, basculer entre tous les niveaux ou uniquement les niveaux clés, et personnaliser les couleurs pour l'activité haussière/baissière.
FONCTIONNALITÉS
Analyse de la distribution du volume
- Point de Contrôle (POC) : Niveau de prix avec la plus haute activité — où le prix a passé le plus de temps
- Zone de Valeur (VA) : Zone de concentration d'activité personnalisable (par défaut 70 %) — où la majorité des échanges ont eu lieu
- VAH/VAL : Limites hautes/basses de la Zone de Valeur — niveaux potentiels de support/résistance
- Visualisation Delta : Barres divisées montrant la direction des chandeliers à chaque niveau de prix
Profil de Marché TPO
- Suivi Time Price Opportunity : Compte combien de périodes de temps ont été échangées à chaque prix
- Lettres TPO : Représentation visuelle du temps passé au prix (séquence A-Z)
- Balance Initiale (IB) : Plage de la première heure — importante pour la structure du day trading
- Marqueurs IB Haut/Bas : Extrêmes de la plage d'ouverture
Options flexibles de retour en arrière
- Basé sur la période : Définissez le nombre de barres à analyser (par exemple, les 120 dernières barres)
- Plage DateTime : Ancrez le profil entre des dates/heures spécifiques pour l'analyse d'événements
- Largeur dynamique : Profils à échelle automatique ou largeur fixe
Options d'affichage
- Barres de volume : Largeur proportionnelle (échelle d'activité) ou barres uniformes en pleine largeur
- Division de la direction des chandeliers dans chaque barre
- Calculs delta avec pourcentages
- Basculer entre tous les niveaux ou uniquement les niveaux clés (POC, VAH, VAL)
- Contrôle de la visibilité des détails Volume/TPO
- Répartition directionnelle avec pourcentages
- Taille de police ajustable et marges basées sur les pips
Personnalisation des couleurs
- Couleurs indépendantes pour les barres directionnelles haussières/baissières
- Couleurs de texte séparées pour delta positif/négatif
- Couleur de texte spécifique au TPO
Optimisé pour la performance
- Recherches temporelles mises en cache et dessin efficace des rectangles
- Recalcul minimal pour une performance fluide
- Calcul delta de qualité professionnelle basé sur la structure des chandeliers
__________________________________________________________________________________________
PLUS D'INDICATEURS GRATUITS
Explorez une large gamme d'outils d'analyse de marché — de la structure et du volume à la régression, la volatilité et les périodes personnalisées.
Le code source est disponible sur le dépôt GitHub.
Tous gratuits à utiliser. Mais si vous souhaitez offrir un café en soutien, vous pouvez le faire ici.
Support/Résistance
Volume
- Profileur d'Activité de Volume
- Analyseur d'Efficacité du Volume
- Analyse du Profil de Volume
- Profil de Volume - Mis à jour
- Analyse de la Répartition du Volume
- VWAP (Prix Moyen Pondéré par le Volume)
Moyennes Mobiles
- Moyenne Mobile Ancrée
- Moyenne Mobile Échelonnée par Écart
- Ligne de Tendance Instantanée
- MA Adaptative de Kaufman avec Vision de Tendance
- Canal de Moyenne Mobile
- Suite de Moyennes Mobiles
- Moyenne Mobile du Canal de Tendance
Utilitaires/Personnalisé
Basé sur la Régression
Volatilité
Oscillateurs
__________________________________________________________________________________________
AVERTISSEMENT
Le trading comporte des risques. Cet indicateur est destiné uniquement à l'analyse technique — appliquez toujours une gestion des risques appropriée et tradez de manière responsable.
RETROACTION & AMELIORATIONS
Si vous avez des suggestions, des demandes de fonctionnalités ou des idées d'amélioration, veuillez laisser un commentaire dans l'onglet Discussion. Vos retours aident à améliorer l'indicateur pour tous.
Résumé
Users can customize lookback periods by number of bars or specific date/time ranges and choose between proportional or full-width volume bars. The indicator also provides delta visualization, splitting tick activity by candle direction with percentage breakdowns, and offers extensive display and color customization options for bullish and bearish activity.
This tool is optimized for performance with cached calculations and efficient drawing methods. It is designed to measure market activity rhythm and tempo based on tick volume, which counts price changes but does not represent actual traded money or liquidity. It is suitable for analyzing volume distribution and market structure across various trading sessions and timeframes.
Avis clients
5 | 100 % | |
4 | 0 % | |
3 | 0 % | |
2 | 0 % | |
1 | 0 % |


![Logo de "[Hamster-Coder] Pivot Points MTF"](https://cdn.ctrader.com/image/webp/4c143e5a-309c-40e3-a578-f04d1e133ffa_31159)