Description
NOTES IMPORTANTES - LIRE EN PREMIER
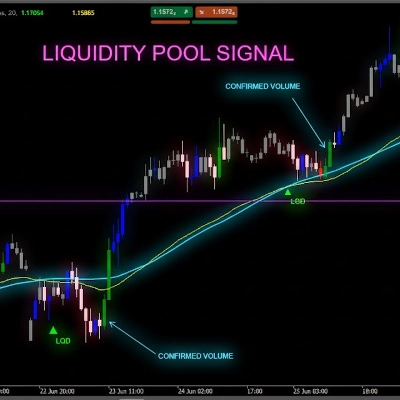
Le volume Forex n'est pas un volume réel
Le volume en forex est un volume de ticks — il compte combien de fois le prix change. Il ne compte PAS combien d'argent a été échangé.
Ce que le volume de ticks ne peut pas montrer
- La taille de la transaction. Une transaction de 100 $ et une transaction de 10 000 000 $ comptent toutes deux comme 1 tick.
- Le flux d'argent réel. Vous ne pouvez pas voir si ce sont les gros ou les petits investisseurs qui ont fait bouger le prix.
- La vraie liquidité. Vous ne pouvez pas voir combien d'ordres attendent sur le marché.
- L'activité des banques. Les banques voient les données de volume réel. Vous ne les voyez pas.
Ce que cela signifie
Le volume de ticks montre seulement la fréquence des changements de prix — pas l'argent derrière. Cela crée des problèmes :
- Vous ne pouvez pas suivre les banques ou les institutions. Elles utilisent des données de volume réel auxquelles vous n'avez pas accès.
- Vous ne pouvez pas prouver les théories du "smart money". Ces idées nécessitent un volume réel, pas un comptage de ticks.
- Vous ne pouvez pas juger la vraie liquidité. L'activité des ticks ne montre pas la profondeur des ordres ni la vraie force du marché.
- Vous ne pouvez pas mesurer le vrai pouvoir d'achat ou de vente. Beaucoup de petites transactions ressemblent à une grosse transaction institutionnelle.
- Les pics de volume peuvent être trompeurs. Un pic peut être juste un bruit algorithmique, pas un véritable intérêt commercial.
Comment utiliser correctement cet indicateur
- Considérez-le comme un indicateur d'activité, pas un indicateur d'argent. Volume de ticks élevé = marché actif. Volume de ticks faible = marché calme. Rien de plus.
- Comparez l'activité entre différentes périodes. Utilisez-le pour voir : La session de Londres est-elle plus active que celle de New York ? Aujourd'hui est-il plus actif qu'hier ? La période de tendance est-elle plus active que la consolidation ?
- Combinez-le avec la structure des prix. Utilisez supports/résistances, points de swing, ou BOS/ChoCH avec le volume. Le contexte des prix évite les faux signaux dus aux pics de volume bruyants.
- Surveillez l'activité aux niveaux de prix importants. Quand le prix teste un niveau clé et que le volume de ticks augmente, cela signifie que plus de traders sont actifs. Cela ne signifie PAS que de gros acteurs sont impliqués.
- Ne supposez pas qu'il montre l'activité institutionnelle. Le volume de ticks ne peut pas montrer l'accumulation, les gros ordres, ou le "smart money". Utilisez-le uniquement pour mesurer le rythme et le tempo.
__________________________________________________________________________________________
Prix Moyen Pondéré par le Volume avec périodes de réinitialisation flexibles et trois méthodes de calcul des bandes.
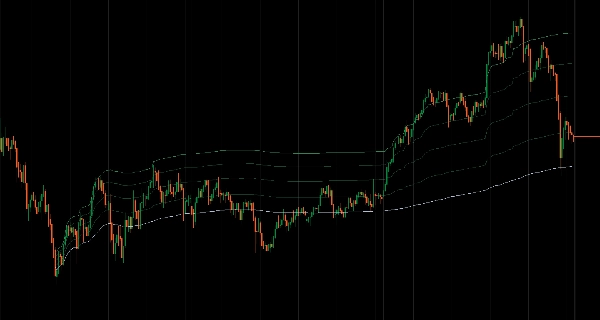
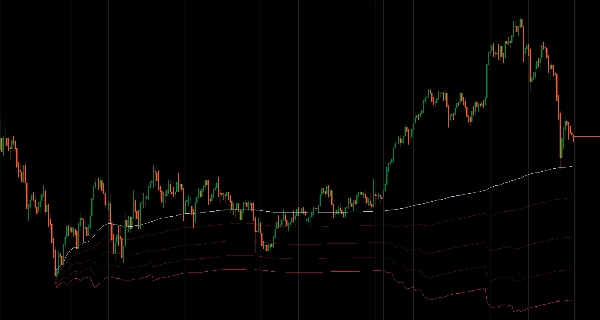
Calcule le Prix Moyen Pondéré par le Volume avec des périodes de réinitialisation flexibles incluant des intervalles basés sur le temps (quotidien, hebdomadaire, mensuel, annuel ou horaire personnalisé), des réinitialisations basées sur les sessions (Asie, Londres, New York avec heures de début configurables), un mode point d'ancrage pour fixer le VWAP à des événements spécifiques, ou un calcul continu à partir de toutes les données disponibles.
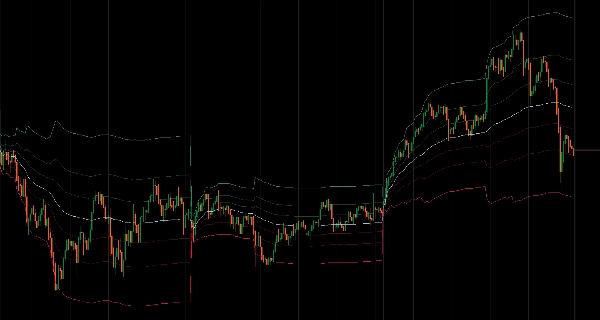
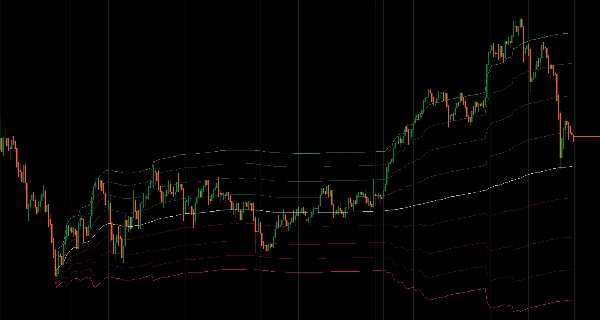
Il offre trois méthodes de calcul des bandes : plage haute/basse basée sur la plage de prix de la période précédente, pivot de Fibonacci utilisant les calculs classiques de pivot, et bandes d'écart-type qui s'élargissent et se contractent avec la volatilité.
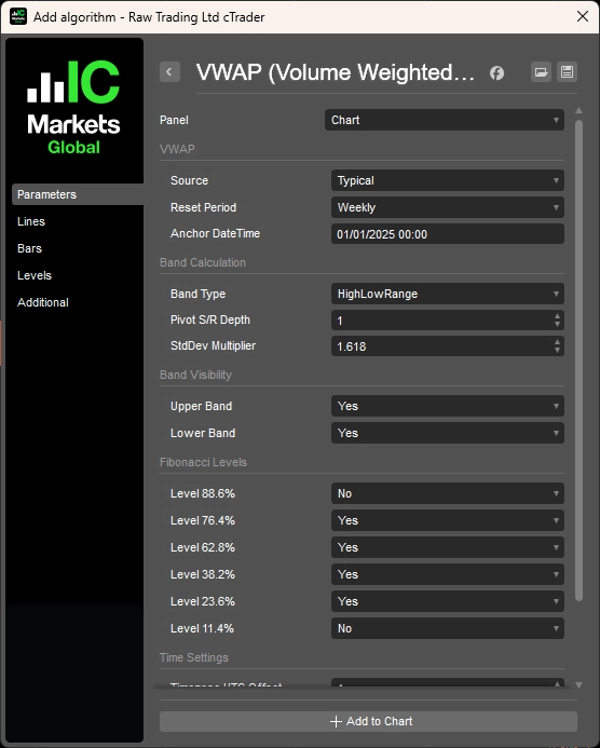
Vous pouvez personnaliser huit niveaux de Fibonacci (100 %, 88,6 %, 76,4 %, 62,8 %, 50 %, 38,2 %, 23,6 %, 11,4 %, 0 %) avec des bascules de visibilité individuelles et des contrôles de groupe rapides pour les bandes supérieures/inférieures. La gestion des sessions inclut la configuration précise de l'heure de début avec ajustement du décalage UTC et la gestion des réinitialisations horaires sensibles au fuseau horaire.
CARACTÉRISTIQUES
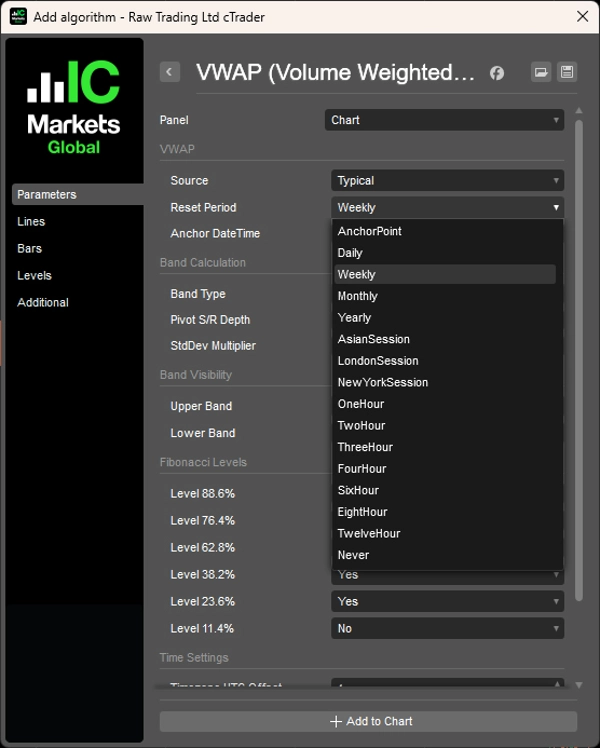
- Périodes de réinitialisation flexibles
-
- Basé sur le temps : Quotidien, Hebdomadaire, Mensuel, Annuel ou intervalles horaires personnalisés (1H, 2H, 3H, 4H, 6H, 8H, 12H)
- Basé sur la session : sessions Asie, Londres, New York avec heures de début configurables et décalages de fuseau horaire
- Point d'ancrage : Fixez le VWAP à n'importe quelle date/heure spécifique pour une analyse basée sur les événements
- Continu : Calcul à partir de toutes les données disponibles sans réinitialisation
- Trois méthodes de calcul des bandes
-
- Plage haute/basse : Bandes basées sur la plage de prix de la période précédente
- Pivot de Fibonacci : Calcul classique du point pivot à partir des H/B/C de la période précédente
- Écart-type : Bandes statistiques traditionnelles qui s'élargissent/se contractent avec la volatilité
- Contrôle complet des niveaux de Fibonacci
-
- 8 niveaux personnalisables : 100 %, 88,6 %, 76,4 %, 62,8 %, 50 % (VWAP), 38,2 %, 23,6 %, 11,4 %, 0 %
- Bascules de visibilité individuelles pour chaque niveau
- Contrôles de groupe pour bandes supérieures/inférieures pour un ajustement rapide
- Gestion des sessions
-
- Configurez les heures exactes de début de session avec ajustement du décalage UTC (-12 à +14 heures)
- Affichage visuel des informations de session montrant le calendrier actuel de réinitialisation
- Gestion des réinitialisations horaires sensible au fuseau horaire
- Optimisé pour la performance
-
- Calcul paresseux — les bandes ne sont calculées que lorsqu'elles sont visibles
- Mise en cache intelligente et traitement par lots
- Impact minimal sur le CPU même avec tous les niveaux activés
__________________________________________________________________________________________
PLUS D'INDICATEURS GRATUITS
Explorez une large gamme d'outils d'analyse de marché — de la structure et du volume à la régression, la volatilité et les périodes personnalisées.
Le code source est disponible sur le dépôt GitHub.
Tous gratuits à utiliser. Mais si vous souhaitez offrir un café en soutien, vous pouvez le faire ici.
Support/Résistance
Volume
- Profileur d'Activité de Volume
- Analyseur d'Efficacité du Volume
- Analyse du Profil de Volume
- Profil de Volume - Mis à jour
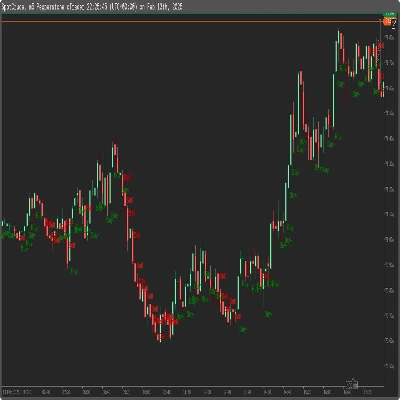
- Analyse de Répartition du Volume
- VWAP (Prix Moyen Pondéré par le Volume)
Moyennes Mobiles
- Canal SSL
- Moyenne Mobile Ancrée
- Moyenne Mobile Échelonnée par Déviation
- Activateur Haut Bas de Gann
- Ligne de Tendance Instantanée
- MA Adaptative de Kaufman avec Vision de Tendance
- Canal de Moyenne Mobile
- Suite de Moyennes Mobiles
- Moyenne Mobile du Canal de Tendance
Utilitaires/Personnalisé
Basé sur la Régression
Volatilité
Oscillateurs
__________________________________________________________________________________________
AVERTISSEMENT
Le trading comporte des risques. Cet indicateur est destiné uniquement à l'analyse technique — appliquez toujours une gestion des risques appropriée et tradez de manière responsable.
RETROACTION & AMÉLIORATIONS
Si vous avez des suggestions, des demandes de fonctionnalités ou des idées d'amélioration, veuillez laisser un commentaire dans l'onglet Discussion. Vos retours aident à améliorer l'indicateur pour tout le monde.
Résumé
The indicator offers three band calculation methods: High/Low Range bands based on the previous period's price range, Fibonacci Pivot bands using classical pivot calculations, and Standard Deviation bands that adjust with market volatility. Users can customize eight Fibonacci levels (ranging from 0% to 100%) with individual visibility toggles and group controls for upper and lower bands.
Session management features include precise start time configuration with UTC offset adjustments and timezone-aware hourly resets, along with visual session information display. Performance optimizations include lazy calculation of bands only when visible, intelligent caching, and batch processing to minimize CPU usage.
Note: For forex markets, volume data represents tick volume (price change counts) rather than actual traded volume, so this indicator should be used as a measure of market activity rather than real money flow. It is intended for technical analysis with proper risk management.
Avis clients
5 | 100 % | |
4 | 0 % | |
3 | 0 % | |
2 | 0 % | |
1 | 0 % |