Description
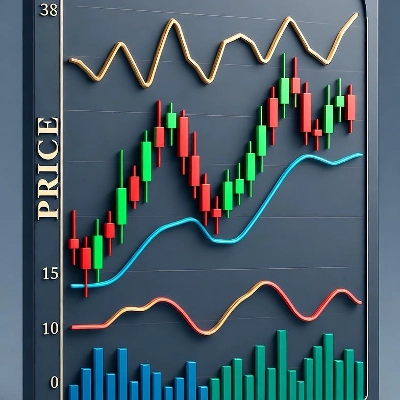
Canaux de prix statistiques avec modes de calcul flexibles et rendu des bandes basé sur la déviation.
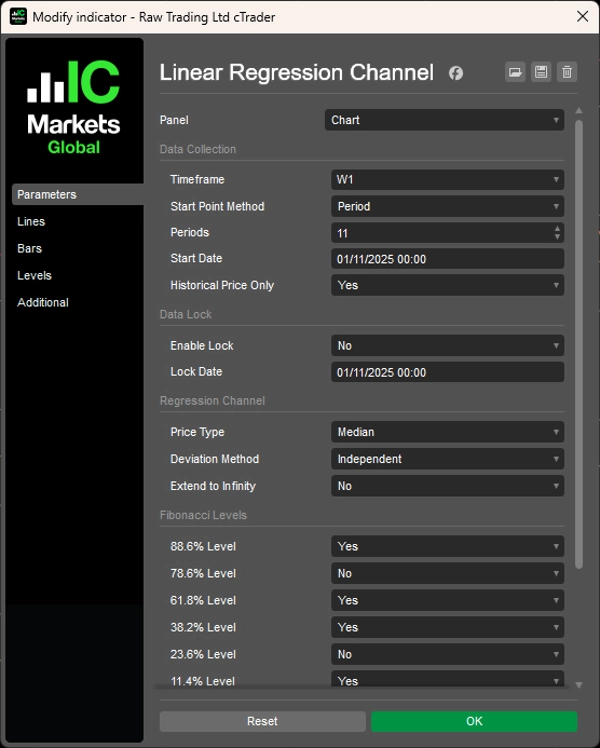
Ajuste des lignes de régression aux données de prix en utilisant le mode Période (derniers N barres), le mode DateHeure (à partir de dates spécifiques) ou le mécanisme de verrouillage pour figer l'analyse à des points historiques pendant que le prix continue.
Trois méthodes de déviation (Moyenne, Indépendante, Maximum) pour des canaux symétriques et asymétriques, six niveaux de retracement de Fibonacci (11,4 % à 88,6 %), analyse multi-échelle, six types de prix (Ouverture/Haut/Bas/Fermeture/Médian/Typique), mode historique uniquement pour des backtests stables, et projection à l'infini offrent une analyse de régression complète pour les traders ciblant les zones de réversion à la moyenne et les limites statistiques des prix dans toutes les conditions de marché.
CARACTÉRISTIQUES
Sélection de données flexible
- Mode Période : Analyse des derniers N barres (par exemple, les 12 dernières chandelles mensuelles)
- Mode DateHeure : Départ à partir d'événements ou de dates de marché spécifiques
- Mécanisme de verrouillage : Figer l'analyse à un point historique pendant que le prix continue
- Multi-échelle : Dessiner la régression depuis n'importe quelle échelle sur votre graphique actuel
Méthodes de déviation intelligentes
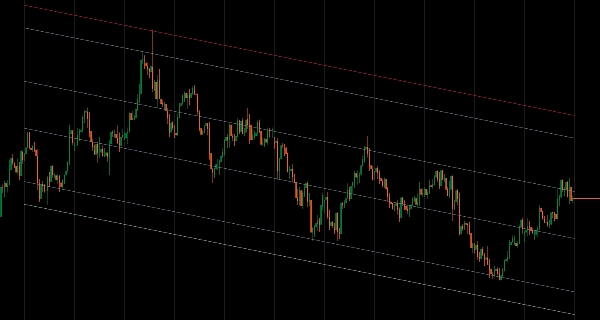
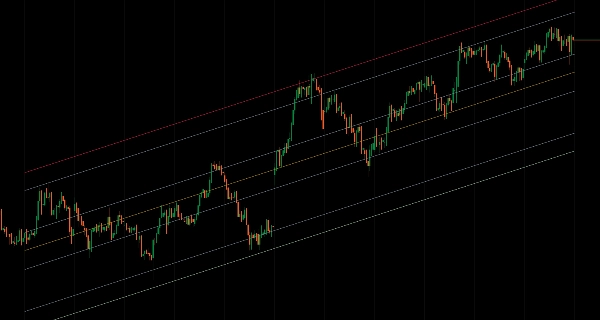
- Moyenne : Niveaux équilibrés utilisant les déviations moyennes — idéal pour les zones de trading
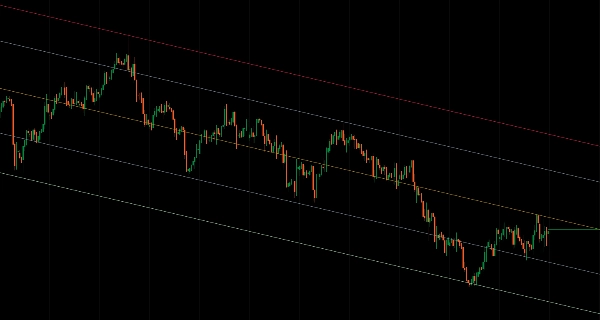
- Indépendante : Canaux asymétriques qui s'adaptent à la volatilité directionnelle
- Maximum : Montre les limites extrêmes des prix pour une analyse de gamme complète
Outils d'analyse professionnels
- 6 niveaux de retracement de Fibonacci (11,4 %, 23,6 %, 38,2 %, 61,8 %, 78,6 %, 88,6 %)
- 6 types de prix : Ouverture, Haut, Bas, Fermeture, Médian, Typique
- Mode historique uniquement : Exclure les barres en formation pour un backtest stable
- Option d'extension à l'infini pour des projections à long terme
Personnalisation complète
- Personnalisation complète des couleurs pour tous les éléments du canal
- Contrôle indépendant de la ligne de régression et des bandes de déviation
- Présentation visuelle épurée pour une analyse ciblée
Capacités avancées
- Fonction de verrouillage pour les études d'analyse basées sur les événements
- Combiner la structure d'une échelle supérieure avec l'exécution d'une échelle inférieure
- Options de canaux symétriques et asymétriques pour différentes conditions de marché
__________________________________________________________________________________________
PLUS D'INDICATEURS GRATUITS
Explorez une large gamme d'outils d'analyse de marché — de la structure et du volume à la régression, la volatilité et les périodes personnalisées.
Le code source est disponible sur le dépôt GitHub.
Tous gratuits à utiliser. Mais si vous souhaitez offrir un café en soutien, vous pouvez le faire ici.
Support/Résistance
Volume
- Profileur d'Activité de Volume
- Analyseur d'Efficacité du Volume
- Analyse du Profil de Volume
- Profil de Volume - Mis à jour
- Analyse de la Répartition du Volume
- VWAP (Prix Moyen Pondéré par le Volume)
Moyennes Mobiles
- Canal SSL
- Moyenne Mobile Ancrée
- Moyenne Mobile Échelonnée par Déviation
- Activateur Haut Bas de Gann
- Ligne de Tendance Instantanée
- Moyenne Mobile Adaptative de Kaufman avec Vision de Tendance
- Canal de Moyenne Mobile
- Suite de Moyennes Mobiles
- Moyenne Mobile du Canal de Tendance
Utilitaires/Personnalisé
Basé sur la Régression
Volatilité
Oscillateurs
__________________________________________________________________________________________
AVERTISSEMENT
Le trading comporte des risques. Cet indicateur est destiné uniquement à l'analyse technique — appliquez toujours une gestion des risques appropriée et tradez de manière responsable.
RETROACTION & AMÉLIORATIONS
Si vous avez des suggestions, des demandes de fonctionnalités ou des idées d'amélioration, veuillez laisser un commentaire dans l'onglet Discussion. Vos retours aident à améliorer l'indicateur pour tous.
Résumé
Avis clients
5 | 100 % | |
4 | 0 % | |
3 | 0 % | |
2 | 0 % | |
1 | 0 % |