Description
Version améliorée avec contrôle du seuil de remplissage partiel, suivi précis de l'âge et niveaux de Fibonacci automatiques sur les gaps.
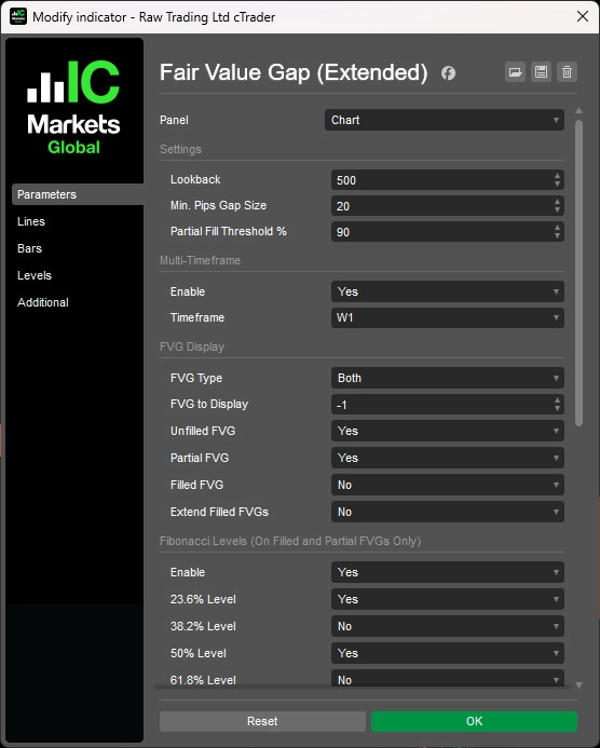
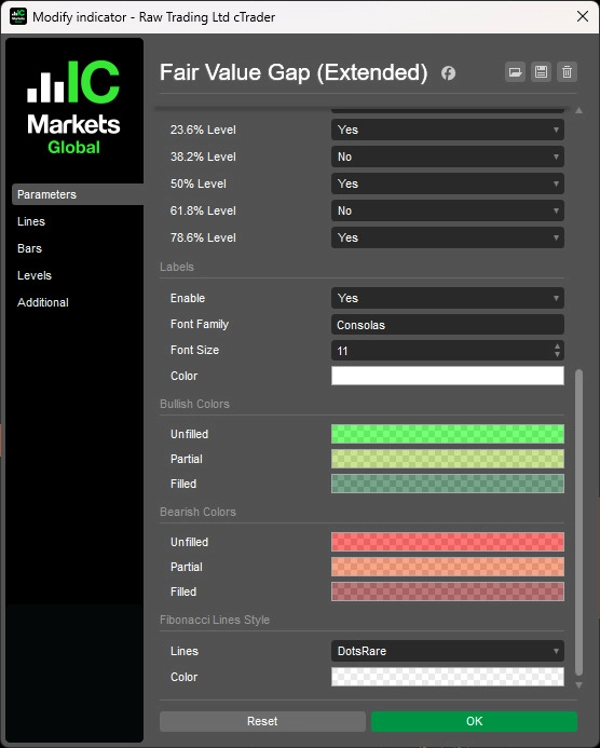
Détecte automatiquement les gaps haussiers et baissiers avec un seuil de remplissage partiel configurable (50-99 %, par défaut 90 %), affiche l'âge du gap au format années/mois/semaines/jours, et projette cinq niveaux de Fibonacci (23,6 % à 78,6 %) sur les FVG partiels et remplis.
Analyse multi-échelles pour aligner les gaps structurels HTF avec l'action des prix LTF, option d'étendre les boîtes FVG remplies jusqu'à la barre actuelle, affichage illimité des gaps historiques (-1 en paramètre), mises à jour dynamiques du statut (non rempli/partiellement rempli/rempli), et étiquetage minimal non intrusif pour une analyse complète du déséquilibre de liquidité destinée aux traders ciblant les remplissages de gaps avec des zones d'entrée basées sur Fibonacci.
FONCTIONNALITÉS
Identification FVG améliorée
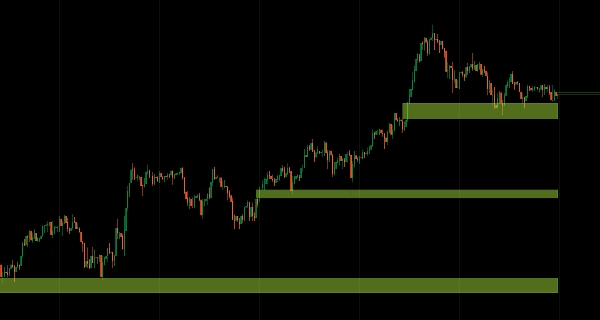
- Trouve automatiquement les Fair Value Gaps haussiers et baissiers
- Suit en temps réel les statuts non rempli, partiellement rempli et complètement rempli
- Seuil de remplissage partiel : contrôle du passage du remplissage partiel au remplissage complet (50-99 %, par défaut 90 %)
- Représentation visuelle claire avec un encombrement minimal du graphique
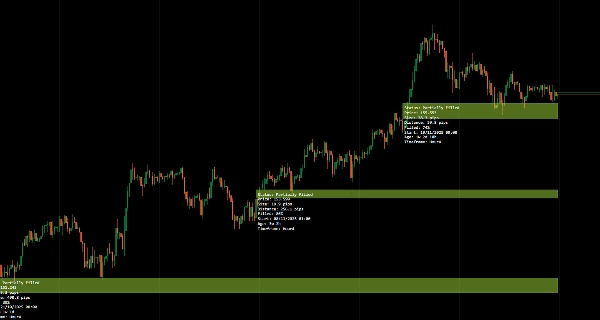
Affichage amélioré de l'âge
- Affiche l'âge précis du gap en années, mois, semaines et jours (ex. : "3a 2s 4j")
- Aide à prioriser les gaps récents par rapport aux gaps anciens pour la sélection des trades
- Le contexte temporel améliore la prise de décision sur la pertinence du gap
Suivi et affichage du statut
- Affiche le statut actuel de remplissage : non rempli, partiellement rempli ou complètement rempli
- Mise à jour dynamique lors de l'interaction du prix avec le gap
- Confirmation visuelle de la capture de liquidité
- Extension des FVG remplis : option d'étendre les boîtes FVG remplies jusqu'à la barre actuelle pour référence
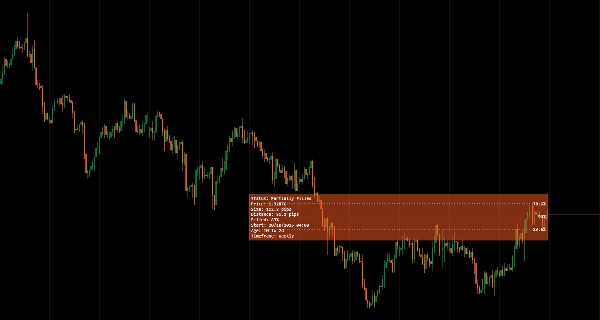
Niveaux de Fibonacci
- Niveaux de Fibonacci automatiques (23,6 %, 38,2 %, 50 %, 61,8 %, 78,6 %) affichés sur les FVG partiels et remplis
- Élimine le besoin de dessiner manuellement les niveaux
- Zones d'entrée précises à l'intérieur des gaps
- Stratégies d'entrée basées sur Fibonacci simplifiées
Mode multi-échelles
- Analyse et affichage des FVG de timeframe supérieur sur des graphiques de timeframe inférieur
- Aligne les gaps structurels HTF avec l'action des prix LTF
- Améliore le flux de travail d'analyse multi-échelles
Afficher tous les FVG
- Réglez "FVG to Display" à -1 pour afficher tous les FVG historiques sans limite
- Visibilité complète du comportement des gaps sur votre graphique
- Suivi des schémas de remplissage des gaps dans le temps
Interface propre et minimaliste
- Étiquettes non intrusives conçues pour la clarté
- Informative sans encombrer votre vue des prix
- Présentation professionnelle pour une analyse ciblée
__________________________________________________________________________________________
PLUS D'INDICATEURS GRATUITS
Explorez une large gamme d'outils d'analyse de marché — de la structure et du volume à la régression, la volatilité et les timeframes personnalisés.
Le code source est disponible sur le dépôt GitHub.
Tous gratuits à utiliser. Mais si vous souhaitez offrir un café en soutien, vous pouvez le faire ici.
Support/Résistance
Volume
- Profileur d'Activité de Volume
- Analyseur d'Efficacité du Volume
- Analyse du Profil de Volume
- Profil de Volume - Mis à jour
- Analyse de la Répartition du Volume
- VWAP (Prix Moyen Pondéré par le Volume)
Moyennes Mobiles
- Canal SSL
- Moyenne Mobile Ancrée
- Moyenne Mobile Échelonnée par Déviation
- Activateur Haut Bas de Gann
- Ligne de Tendance Instantanée
- Moyenne Mobile Adaptative Kaufman avec Vision de Tendance
- Canal de Moyenne Mobile
- Suite de Moyennes Mobiles
- Moyenne Mobile du Canal de Tendance
Utilitaires/Personnalisés
Basé sur la Régression
Volatilité
Oscillateurs
__________________________________________________________________________________________
AVERTISSEMENT
Le trading comporte des risques. Cet indicateur est destiné uniquement à l'analyse technique — appliquez toujours une gestion des risques appropriée et tradez de manière responsable.
RETROACTION & AMELIORATIONS
Si vous avez des suggestions, des demandes de fonctionnalités ou des idées d'amélioration, veuillez laisser un commentaire dans l'onglet Discussion. Vos retours aident à améliorer l'indicateur pour tous.
Résumé
The indicator displays the precise age of each gap in years, months, weeks, and days, aiding traders in prioritizing fresh versus stale gaps. It projects five Fibonacci retracement levels (23.6%, 38.2%, 50%, 61.8%, 78.6%) on partial and filled gaps, providing predefined entry zones based on Fibonacci ratios without manual drawing.
Fair Value Gap (Extended) supports multi-timeframe analysis by scanning higher timeframe gaps and displaying them on lower timeframe charts, facilitating alignment of structural gaps with price action. It offers options to extend filled gap boxes to the current bar and to display unlimited historical gaps for comprehensive gap behavior tracking.
The indicator features a clean, minimal user interface with non-intrusive labels, delivering clear liquidity imbalance insights for traders focusing on gap fills and Fibonacci-based entries.
Avis clients
5 | 100 % | |
4 | 0 % | |
3 | 0 % | |
2 | 0 % | |
1 | 0 % |