Description
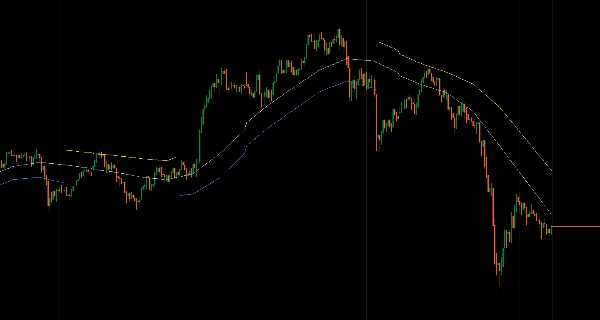
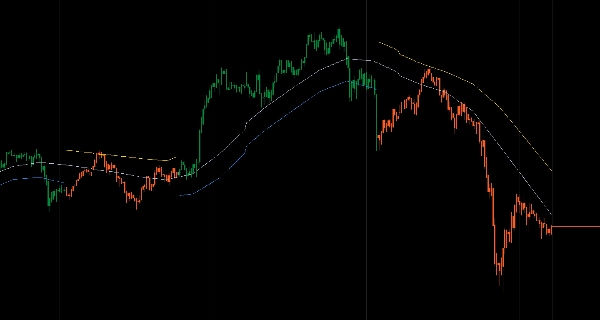
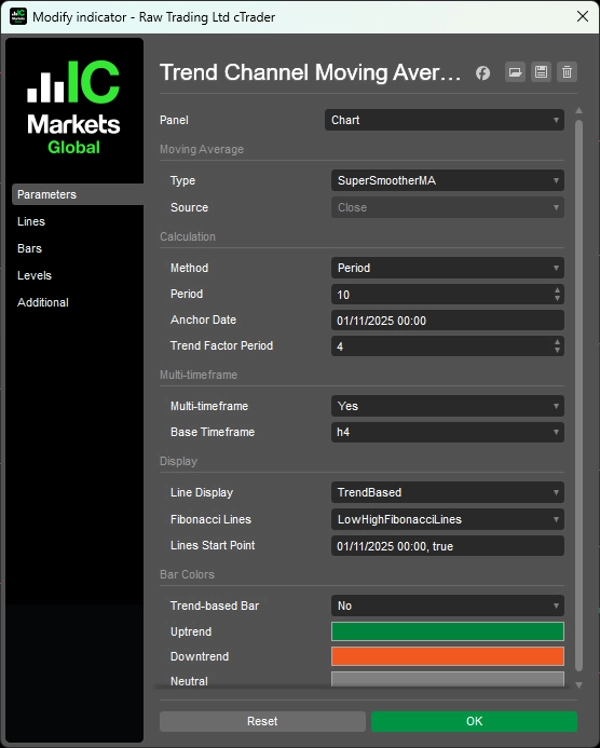
Système de canal adaptatif tricolore utilisant des moyennes mobiles sur les quatre prix OHLC pour l'analyse de la direction et de la structure de la tendance.
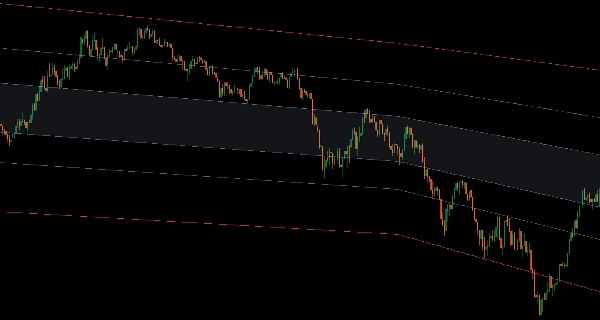
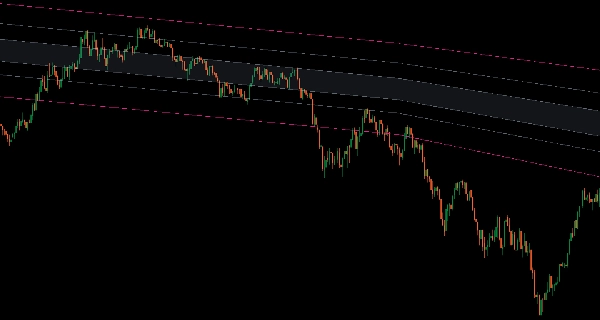
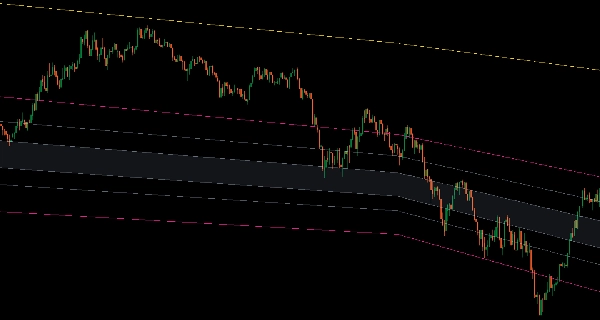
Affiche les limites Haut/Bas, les lignes de biais directionnel Ouverture/Fermeture, et l'équilibre Médian avec des états de tendance codés par couleur (Bleu tendance haussière, Or tendance baissière, Gris neutre) qui s'adaptent ensemble.
Deux modes d'affichage (canal complet ou réduction de l'encombrement basée sur la tendance), six zones de Fibonacci optionnelles (retracements du canal complet, niveaux de demi-canal, extensions de cassure), 15 algorithmes de moyenne mobile (Arnaud Legoux, Jurik, Hull, KAMA, VIDYA, Déviation Échelonnée, SuperSmoother, Ultimate Smoother, McGinley Dynamic, T3, ZLEMA, Laguerre), interpolation multi-échelle temporelle, calcul de date d'ancrage pour des périodes croissantes basées sur des événements, et coloration des barres basée sur la tendance offrent une structure de canal cohérente pour les traders ciblant les replis et la réversion vers la moyenne dans des limites définies.
CARACTÉRISTIQUES
Système de Tendance Tricolore
- Lignes bleues : Tendance haussière confirmée — tradez les replis vers la ligne basse
- Lignes dorées : Tendance baissière confirmée — tradez les rebonds vers la ligne haute
- Lignes grises : Neutre/en range — évitez les extrêmes, scalpez le milieu
- Toutes les lignes s'adaptent ensemble — pas de signaux contradictoires
Structure Complète du Canal
- Les lignes Haut/Bas définissent les limites du canal
- Les lignes Ouverture/Fermeture montrent le biais directionnel à l'intérieur du canal
- La ligne Médiane (centre des quatre) marque le véritable équilibre
- Structure intégrée qui évolue de manière cohésive
Deux Modes d'Affichage
- Mode Canal : Affiche toujours les deux limites avec les couleurs de tendance
- Mode Basé sur la Tendance : Cache la ligne haute dans les tendances haussières, la ligne basse dans les tendances baissières — réduit l'encombrement visuel, garde le focus sur la limite tradable
6 Zones de Fibonacci (Optionnel)
- Entre Bas-Haut (retracements du canal complet)
- Entre Bas-Médian ou Médian-Haut (niveaux de demi-canal)
- Extensions supérieures/inférieures (objectifs de cassure)
- Plage totale (de l'extension inférieure à supérieure)
15 Types de Moyennes Mobiles
- Algorithmes professionnels : Arnaud Legoux, Jurik, Hull, KAMA, VIDYA, Déviation Échelonnée, SuperSmoother, Ultimate Smoother, McGinley Dynamic, T3, ZLEMA, Laguerre
- Signaux clairs optimisés pour l'identification de tendance
Fonctionnalités Avancées
- Mode multi-échelle temporelle avec interpolation fluide
- Calcul de date d'ancrage (période croissante à partir d'un événement/niveau spécifique)
- Coloration des barres basée sur la tendance (optionnelle)
- Contrôle du point de départ des lignes (cacher les données historiques, afficher uniquement la structure récente)
__________________________________________________________________________________________
PLUS D'INDICATEURS GRATUITS
Explorez une large gamme d'outils d'analyse de marché — de la structure et du volume à la régression, la volatilité et les échelles temporelles personnalisées.
Le code source est disponible sur le dépôt GitHub.
Tous gratuits à utiliser. Mais si vous souhaitez offrir un café en soutien, vous pouvez le faire ici.
Support/Résistance
Volume
- Profileur d'Activité de Volume
- Analyseur d'Efficacité du Volume
- Analyse du Profil de Volume
- Profil de Volume - Mis à Jour
- Analyse de la Répartition du Volume
- VWAP (Prix Moyen Pondéré par le Volume)
Moyennes Mobiles
- Canal SSL
- Moyenne Mobile Ancrée
- Moyenne Mobile à Déviation Échelonnée
- Activateur Haut Bas de Gann
- Ligne de Tendance Instantanée
- Moyenne Mobile Adaptative de Kaufman avec Vision de Tendance
- Canal de Moyenne Mobile
- Suite de Moyennes Mobiles
- Moyenne Mobile du Canal de Tendance
Utilitaires/Personnalisé
Basé sur la Régression
Volatilité
Oscillateurs
__________________________________________________________________________________________
AVERTISSEMENT
Le trading comporte des risques. Cet indicateur est destiné uniquement à l'analyse technique — appliquez toujours une gestion des risques appropriée et tradez de manière responsable.
RETROACTION & AMÉLIORATIONS
Si vous avez des suggestions, des demandes de fonctionnalités ou des idées d'amélioration, veuillez laisser un commentaire dans l'onglet Discussion. Vos retours aident à améliorer l'indicateur pour tous.
Résumé
Key features include two display modes—full channel and trend-based clutter reduction—and six optional Fibonacci zones covering full and half-channel retracements plus breakout extensions. The system supports 15 professional moving average algorithms such as Arnaud Legoux, Jurik, Hull, KAMA, VIDYA, and others, optimized for clean trend identification. Additional functionalities include multi-timeframe interpolation, anchor date calculation for event-based periods, trend-based bar coloring, and control over line start points to focus on recent data.
This indicator is designed to help traders identify pullbacks and mean reversion opportunities within defined channel boundaries, enhancing decision-making in various market conditions.
Avis clients
5 | 100 % | |
4 | 0 % | |
3 | 0 % | |
2 | 0 % | |
1 | 0 % |