
Description
VERSION MISE À JOUR DU PROFIL DE VOLUME
Comparé à la version précédente, cette version mise à jour inclut des corrections de bugs critiques, de nouvelles fonctionnalités et des améliorations significatives des performances :
Corrections
- Correction de la distribution du volume : allocation proportionnelle basée sur le chevauchement des chandeliers au lieu de 100 % à tous les niveaux touchés
- Correction de la détection VAH/VAL : la tolérance s'adapte à la hauteur du niveau au lieu d'une valeur codée en dur
- Correction du positionnement du texte : décalages dynamiques basés sur la période au lieu de jours codés en dur
- Correction de la validation DateTime : vérification des barres vides, validation hors plage
Fonctionnalités
- Ajout du paramètre de décalage de fuseau horaire pour les profils DateTime
- Ajout du paramètre de position du texte (Gauche/Droite) pour le mode rétrospectif
- Les étiquettes du mode DateTime suivent désormais les bords des barres (largeur variable) ou s'alignent sur le bord du profil (largeur complète)
Performances
- Recherche binaire pour la recherche d'index DateTime (était linéaire O(n))
- Calcul du volume total mis en cache (était recalculé par niveau)
- Dictionnaire TPO pré-dimensionné pour éviter le redimensionnement
- Modèle TryGetValue pour les recherches dans le dictionnaire
- Boucles basées sur l'index remplaçant foreach dans les chemins critiques
Nettoyage
- Suppression du paramètre ProfileWidth (le calcul automatique est toujours correct)
- Simplification de l'intersection des chandeliers en une seule condition
__________________________________________________________________________________________
NOTES IMPORTANTES - À LIRE EN PREMIER
Le volume Forex n'est pas un volume réel
Le volume en forex est le volume de ticks — il compte combien de fois le prix change. Il ne compte PAS combien d'argent a été échangé.
Ce que le volume de ticks ne peut pas montrer
- La taille des transactions. Une transaction de 100 $ et une de 10 000 000 $ comptent toutes deux pour 1 tick.
- Le flux d'argent réel. Vous ne pouvez pas voir si ce sont les gros ou petits investisseurs qui ont fait bouger le prix.
- La vraie liquidité. Vous ne pouvez pas voir combien d'ordres attendent sur le marché.
- L'activité des banques. Les banques voient les données de volume réel. Pas vous.
Ce que cela signifie
Le volume de ticks montre seulement la fréquence des changements de prix — pas l'argent derrière. Cela crée des problèmes :
- Vous ne pouvez pas suivre les banques ou institutions. Elles utilisent des données de volume réel auxquelles vous n'avez pas accès.
- Vous ne pouvez pas prouver les théories du "smart money". Ces idées nécessitent le volume réel, pas le comptage des ticks.
- Vous ne pouvez pas juger la vraie liquidité. L'activité des ticks ne montre pas la profondeur des ordres ni la vraie force du marché.
- Vous ne pouvez pas mesurer la vraie puissance d'achat ou de vente. Beaucoup de petites transactions ressemblent à une grosse transaction institutionnelle.
- Les pics de volume peuvent être trompeurs. Un pic peut être juste un bruit algorithmique, pas un réel intérêt de trading.
Comment utiliser correctement cet indicateur
- Considérez-le comme un indicateur d'activité, pas un indicateur d'argent. Volume de ticks élevé = marché actif. Volume de ticks faible = marché calme. Rien de plus.
- Comparez l'activité entre différentes périodes. Utilisez-le pour voir : La session de Londres est-elle plus active que New York ? Aujourd'hui est-il plus actif qu'hier ? La période de tendance est-elle plus active que la consolidation ?
- Combinez-le avec la structure des prix. Utilisez supports/résistances, points de swing ou BOS/ChoCH avec le volume. Le contexte des prix évite les faux signaux dus aux pics de volume bruyants.
- Surveillez l'activité aux niveaux de prix importants. Quand le prix teste un niveau clé et que le volume de ticks augmente, cela signifie que plus de traders sont actifs. Cela ne signifie PAS que les gros acteurs sont impliqués.
- Ne supposez pas que cela montre l'activité institutionnelle. Le volume de ticks ne peut pas montrer l'accumulation, les gros ordres ou le "smart money". Utilisez-le seulement pour mesurer le rythme et le tempo.
__________________________________________________________________________________________
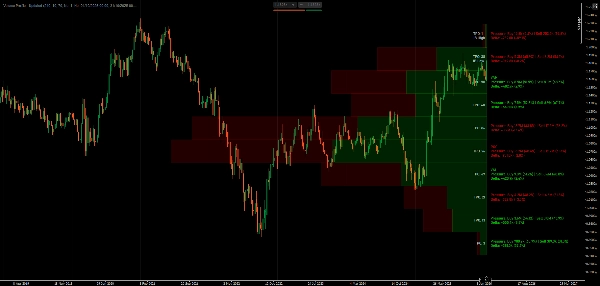
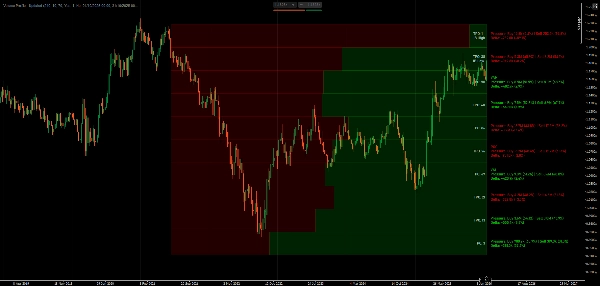
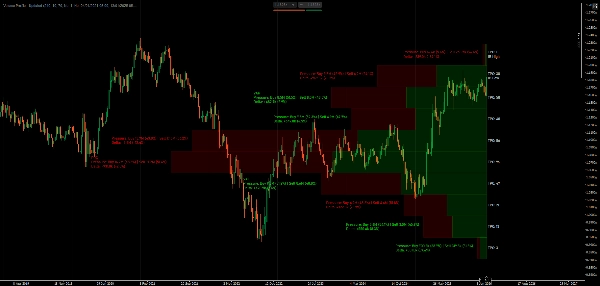
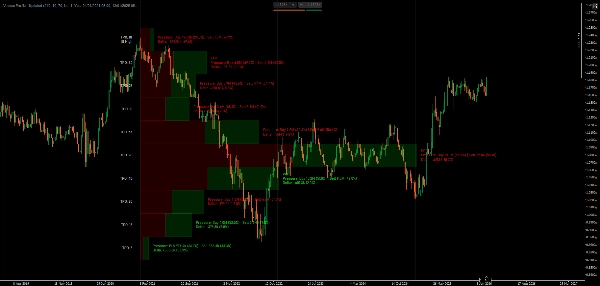
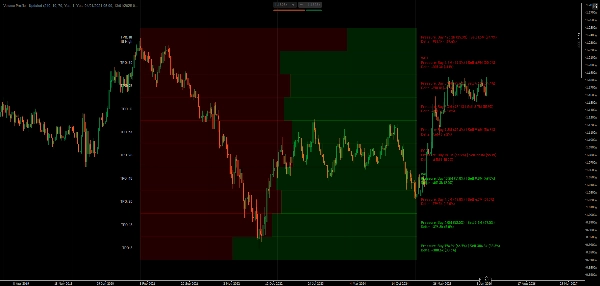
Visualisez la distribution du volume et le temps passé au prix avec le POC, la zone de valeur et le suivi TPO du profil de marché.
Cet indicateur montre la distribution du volume en utilisant les concepts du profil de marché. Il affiche le Point de Contrôle (niveau d'activité de ticks le plus élevé), les limites de la zone de valeur (où la plupart des échanges ont eu lieu), les séquences de lettres TPO (temps passé à chaque prix), et la visualisation delta qui divise l'activité des ticks selon la direction des chandeliers.
Vous pouvez choisir des périodes de rétrospective ou définir des plages de dates spécifiques, afficher les barres de volume en largeur proportionnelle ou pleine largeur, basculer entre tous les niveaux ou seulement les niveaux clés, et personnaliser les couleurs pour l'activité haussière/baissière.
FONCTIONNALITÉS
Analyse de la distribution du volume
- Point de Contrôle (POC) : Niveau de prix avec la plus haute activité — où le prix a passé le plus de temps
- Zone de Valeur (VA) : Zone de concentration d'activité personnalisable (par défaut 70 %) — où la plupart des échanges ont eu lieu
- VAH/VAL : Limites hautes/basses de la zone de valeur — niveaux potentiels de support/résistance
- Visualisation delta : Les barres divisées montrent la direction des chandeliers à chaque niveau de prix
Profil de marché TPO
- Suivi Time Price Opportunity : Compte combien de périodes de temps ont été échangées à chaque prix
- Lettres TPO : Représentation visuelle du temps passé au prix (séquence A-Z)
- Balance Initiale (IB) : Plage de la première heure — importante pour la structure du day trading
- Marqueurs IB Haut/Bas : Extrêmes de la plage d'ouverture
Options de rétrospective flexibles
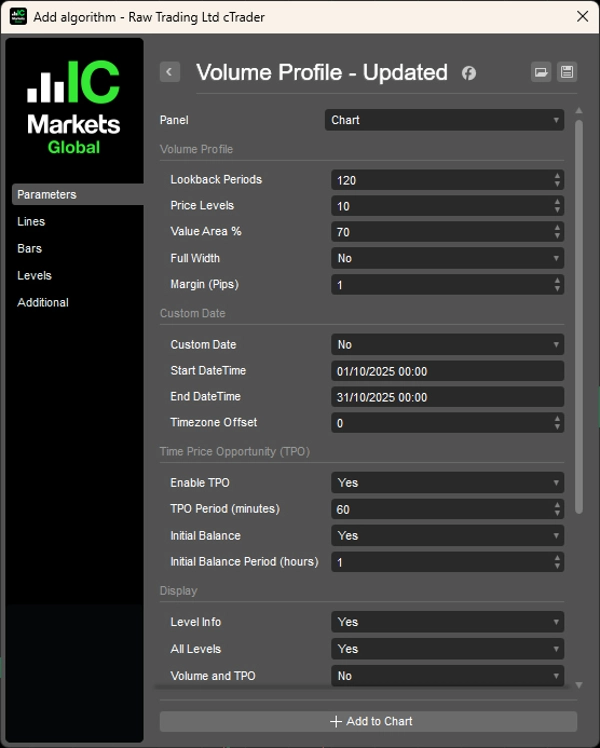
- Basé sur la période : Définissez le nombre de barres à analyser (par exemple, les 120 dernières barres)
- Plage DateTime : Ancrez le profil entre des dates/heures spécifiques pour l'analyse d'événements
- Largeur dynamique : Profils à échelle automatique ou largeur fixe
Options d'affichage
- Barres de volume : Largeur proportionnelle (échelle d'activité) ou barres uniformes pleine largeur
- Division de la direction des chandeliers dans chaque barre
- Calculs delta avec pourcentages
- Basculer entre tous les niveaux ou seulement les niveaux clés (POC, VAH, VAL)
- Contrôle de la visibilité des détails Volume/TPO
- Répartition directionnelle avec pourcentages
- Taille de police ajustable et marges basées sur les pips
Personnalisation des couleurs
- Couleurs indépendantes pour les barres directionnelles haussières/baissières
- Couleurs de texte séparées pour delta positif/négatif
- Couleur de texte spécifique au TPO
Optimisé pour la performance
- Recherches de temps mises en cache et dessin efficace des rectangles
- Recalcul minimal pour des performances fluides
- Calcul delta de qualité professionnelle basé sur la structure des chandeliers
__________________________________________________________________________________________
PLUS D'INDICATEURS GRATUITS
Explorez une large gamme d'outils d'analyse de marché — de la structure et du volume à la régression, la volatilité et les périodes personnalisées.
Le code source est disponible sur le dépôt GitHub.
Tous gratuits à utiliser. Mais si vous souhaitez offrir un café en soutien, vous pouvez le faire ici.
Support/Résistance
Volume
- Profileur d'Activité de Volume
- Analyseur d'Efficacité du Volume
- Analyse du Profil de Volume
- Profil de Volume - Mis à Jour
- Analyse de la Répartition du Volume
- VWAP (Prix Moyen Pondéré par le Volume)
Moyennes Mobiles
- Canal SSL
- Moyenne Mobile Ancrée
- Moyenne Mobile Échelonnée par Déviation
- Activateur Haut Bas de Gann
- Ligne de Tendance Instantanée
- MA Adaptative de Kaufman avec Vision de Tendance
- Canal de Moyenne Mobile
- Suite de Moyennes Mobiles
- Moyenne Mobile du Canal de Tendance
Utilitaires/Personnalisé
Basé sur la Régression
Volatilité
Oscillateurs
__________________________________________________________________________________________
AVERTISSEMENT
Le trading comporte des risques. Cet indicateur est destiné uniquement à l'analyse technique — appliquez toujours une gestion des risques appropriée et tradez de manière responsable.
RETROACTION & AMELIORATIONS
Si vous avez des suggestions, des demandes de fonctionnalités ou des idées d'amélioration, veuillez laisser un commentaire dans l'onglet Discussion. Vos retours aident à améliorer l'indicateur pour tous.
Résumé
Key features include customizable lookback periods based on bar count or specific date/time ranges, dynamic or fixed profile widths, and display options for proportional or full-width volume bars. Users can toggle visibility of all levels or key levels (POC, VAH, VAL) and adjust colors independently for bullish/bearish bars and delta text. The indicator tracks Initial Balance (IB) ranges and marks IB High/Low for day trading structure.
Performance optimizations include binary search for DateTime lookups, cached volume calculations, and efficient data structures to minimize recalculations. The indicator uses tick volume, which counts price changes rather than actual traded volume, making it suitable as a market activity meter rather than a measure of real money flow or liquidity.
Supported markets include Forex, Indices, Commodities, Crypto, and Stocks. The indicator is intended for technical analysis and includes parameters for timezone offset and text positioning.
Avis clients
5 | 100 % | |
4 | 0 % | |
3 | 0 % | |
2 | 0 % | |
1 | 0 % |


![Logo de "[Hamster-Coder] Pivot Points MTF"](https://cdn.ctrader.com/image/webp/4c143e5a-309c-40e3-a578-f04d1e133ffa_31159)


