Brokers & props
For business
00
Days
:
00
Hours
:
00
Minutes
:
00
Seconds
Indicator
Indices
Commodities
Stocks
Forex
Crypto
Moving Average Channel
06/12/2025
22
Desktop
Since 20/12/2024
Free installs
935
"Moving Average Channel" uploaded image"Moving Average Channel" uploaded image"Moving Average Channel" uploaded image"Moving Average Channel" uploaded image

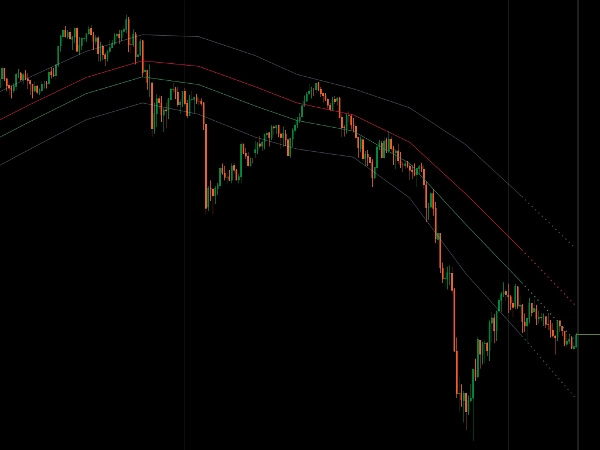
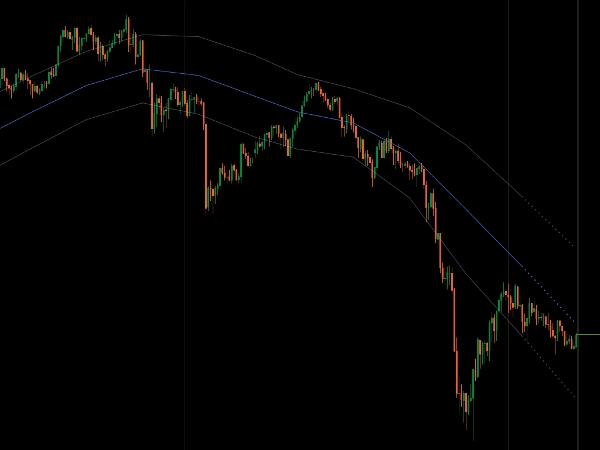
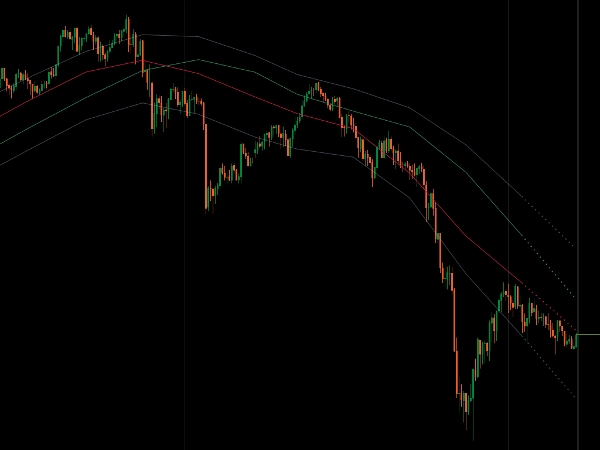
Dynamic price channel using moving averages on all four OHLC prices for complete market structure analysis.


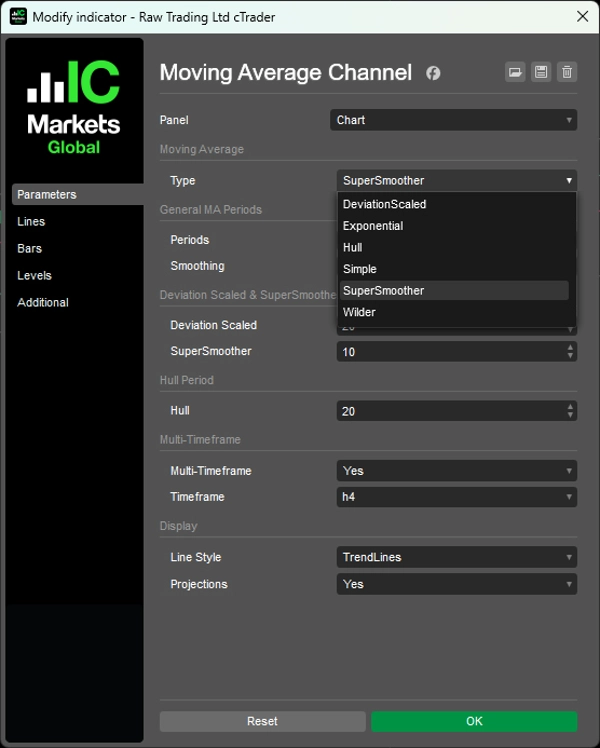
Applies your chosen MA type (Simple, Exponential, Wilder, Deviation Scaled, SuperSmoother, Hull) to High/Low boundaries, Open/Close directional bias, and Median equilibrium line for cohesive channel visualization.

Built-in Fibonacci reversion zones (38.2%, 61.8%), dual smoothing layer for SMA/EMA creating ultra-clean channels, multi-timeframe display with traditional stairstep or diagonal trendline modes, smart momentum-based projections, and boundary rejection detection deliver comprehensive channel structure for traders targeting mean reversion and trend strength assessment across timeframes.


Features


Complete Price Structure

  • High/Low define channel boundaries
  • Open/Close show directional bias
  • Median line: 50% level between High/Low—the true center of market balance
  • Four prices working together to show complete market picture


Built-in Reversion Zones

  • Fibonacci 38.2% and 61.8% levels mark statistically significant pullback areas
  • Dynamic zones that adapt with price movement
  • Clear entry and exit reference points


6 Moving Average Types

  • Simple, Exponential, Wilder, Deviation Scaled, SuperSmoother, Hull
  • Dual smoothing for SMA/EMA: Period + additional smoothing layer for ultra-clean channels
  • Advanced algorithms: Deviation Scaled adapts to volatility, SuperSmoother removes lag, Hull emphasizes recent price action


Multi-Timeframe with Trendlines

  • View higher timeframe channel on lower timeframe charts
  • Two display modes: Traditional stairstep lines or diagonal trendlines (MTF only)
  • Lines connect MTF bar closes for clean diagonal structure
  • Smart projections show where the channel is heading based on current momentum


Clean Visual System

  • Channel slope shows momentum
  • Price position shows trend strength
  • Boundary rejections signal potential reversals
  • One indicator for complete market structure analysis


__________________________________________________________________________________________


More Free Indicators


Check out my other indicators—each one built with production-level code quality and practical features traders actually need.

All free to use. But if you feel like sending coffee support, you can route it to tinyurl(dot)com/coffee-supply


Moving Averages


Regression-Based


Support/Resistance


Volatility


Volume Indicators


Utilities/Custom


__________________________________________________________________________________________


Disclaimer

Trading involves risk. This indicator is intended for technical analysis only — always apply proper risk management and trade responsibly.


Feedback & Improvements

If you have suggestions, feature requests, or ideas for enhancement, please leave a comment in the Discussion tab. Your feedback helps improve the indicator for everyone.

0.0
Reviews: 0
Customer reviews
No reviews for this product yet. Already tried it? Be the first to tell others!
More from this author
VWAP (Volume Weighted Average Price)
Customizable VWAP with flexible reset, three band methods, and full Fibonacci level control.
Fair Value Gap
FVG Detector: Identify and label Fair Value Gaps, with age, status & multi-timeframe support.
Indicator
Fibonacci
Simple Pivot Points
Clear pivot levels. Clean S/R zones. Five methods. Any timeframe.
Volume Profile Analytics
Volume distribution analysis with Market Profile TPO integration.
Indicator
Breakout
Higher Timeframe Candlestick
Overlay a real-time higher-timeframe candle on your chart — color-coded bias without switching TFs.
Indicator
FVG
Fibonacci
Fair Value Gap (Extended)
Detect FVGs with age, status, Fibonacci levels, and customizable fill threshold—extended version.
Indicator
Breakout
Round Number
Plots automatic psychological levels at round-number zones – major structure & liquidity levels.
Indicator
Breakout
Fibonacci
Linear Regression Channel
Statistically-grounded trend channels via linear regression — clear trend & reversal zones.
Indicator
Bollinger
Trend Channel Moving Average
Complete MA-channel system: colored trend, channel boundaries & equilibrium with 6 Fib zones.
Indicator
Indices
Commodities
Stocks
+2
Moving Averages Suite
28-method MA library in one indicator — from classic EMAs to adaptive & zero-lag variants.
Indicator
Scalping
Nadaraya-Watson Kernel Regression
Ultra-smooth adaptive trend line via Gaussian kernel regression — low lag, clean structure.
Indicator
Scalping
Kaufman Adaptive MA with Trend Vision
Adaptive KAMA: fast in trend, slow in noise — with color-coded market state visualization.
Indicator
Breakout
Fibonacci
Initial Balance
Track Initial Balance ranges across any period with optional Fibonacci levels and projections.
Indicator
Breakout
ATR
Scalping
Trend Volatility Trail
A volatility-adaptive trend-following indicator that dynamically adjusts to market conditions.
Indicator
Indices
Stocks
Commodities
+2
Custom Timeframes
Custom and native timeframes display with OHLC lines, moving averages, and Fibonacci levels.
Indicator
Fibonacci
Anchored Moving Average
Anchor a moving average to any point on the chart and watch it extend dynamically as price evolves.
Indicator
Indices
Stocks
Commodities
+2
Deviation-Scaled Moving Average
Momentum-adaptive MA: scales responsiveness via deviation — fast in trend, smooth in chop.
Indicator
Fibonacci
Advanced Regression Channel
Regression channels with Fibonacci levels across multiple regression types, timeframes, and custom date ranges.
You may also like
R S
This indicator is a simple, single-timeframe tool for showing candle sentiment directly on your chart. If you want a mor
Indicator
Breakout
ATR
Scalping
Trend Volatility Trail
A volatility-adaptive trend-following indicator that dynamically adjusts to market conditions.
CandleColourFlow_MultiFx
CandleColourFlow MultiFx - optimized to work on Fx Majors, Fx MInors, Fx Crosses
Indicator
Indices
Breakout
Commodities
+3
Trend Lines Auto - FXMaster
Auto Trend Line Indicator for cTrader
Indicator
Indices
Stocks
Commodities
+2
SymbolTFOverlay
The SymbolTFOverlay display the current symbol and timeframe as a semi-transparent text overlay on the chart.
Indicator
NZDUSD
Forex
EURUSD
+4
CandleColourFlow_ MultiFx_1.1
Advanced multi-pair indicator that enhances trend clarity and momentum reading across all major and minor Forex symbols.
ADX and ADI
This custom indicator is a complete implementation of the Average Directional Index and Directional Indicators.
Indicator
NAS100
Indices
NZDUSD
+9
Volumatic Fair Value Gaps
📊 Detects Fair Value Gaps with lower timeframe volume analysis & clean dashboard 🟢🔴
Indicator
RSI
Breakout
XAUUSD
+5
STOCHX 2026 ULTRA
🚀 STOCHX Indicator - Advanced Smoothed Momentum 🚀
DailyPivotPoints
Daily Pivot Points plots key support and resistance levels to guide precise trading decisions.
Zero Lag Exponential Moving Average
ZLEMA (Zero Lag EMA) is a faster, smoother version of EMA, ideal for capturing quick market shifts and trends.
Indicator
NZDUSD
Forex
EURUSD
+2
AlgoCorner Market Sessions
Show each Market Session with full details, including grid mode for higher timeframes, statistics, and other metrics.
Weekly Daily Levels
The Weekly Daily Levels indicator shows the OHLC, and mid-point prices for the previous day and week.
[Hamster-Coder] Moving Average
Universal Moving Average indicator with extended features
Indicator
Indices
RSI
Forex
+3
RSI Reversal Hunter pro
A powerful RSI-based hunter that detects early reversals and snipes market turning points with high accuracy.
Indicator
NAS100
NZDUSD
XAUUSD
+11
WT - RR Tool
Lightweight Risk-Reward Visualization Tool.
Order Flow Ticks v2.0
Indicator
ATR
Forex
RISK V1
Automated position sizing based on risk, entry, and stop loss with ATR support and visual trade setup on charts.