
Description
IMPORTANT NOTES - READ FIRST
Forex Volume Is Not Real Volume
Volume in forex is tick volume — it counts how many times price changes. It does NOT count how much money was traded.
What Tick Volume Cannot Show
- Trade size. A $100 trade and a $10,000,000 trade both count as 1 tick.
- Real money flow. You cannot see if big money or small money moved the price.
- True liquidity. You cannot see how many orders are waiting in the market.
- Bank activity. Banks see real volume data. You do not.
What This Means
Tick volume only shows how often price changed — not the money behind it. This creates problems:
- You cannot track banks or institutions. They use real volume data that you don't have access to.
- You cannot prove "smart money" theories. Those ideas need real volume, not tick counts.
- You cannot judge true liquidity. Tick activity does not show order depth or real market strength.
- You cannot measure real buying or selling power. Many small trades look the same as one big institutional trade.
- Volume spikes can lie. A spike might be just algorithmic noise, not real trading interest.
How to Use This Indicator Correctly
- Treat it as an activity meter, not a money meter. High tick volume = market is busy. Low tick volume = market is quiet. Nothing more.
- Compare activity between different times. Use it to see: Is London session busier than New York? Is today more active than yesterday? Is the trend period busier than consolidation?
- Combine it with price structure. Use support/resistance, swing points, or BOS/ChoCH together with volume. Price context prevents false signals from noisy volume spikes.
- Watch activity at important price levels. When price tests a key level and tick volume increases, it means more traders are active. It does NOT mean big players are involved.
- Do not assume it shows institutional activity. Tick volume cannot show accumulation, large orders, or "smart money." Use it only to measure rhythm and tempo.
__________________________________________________________________________________________
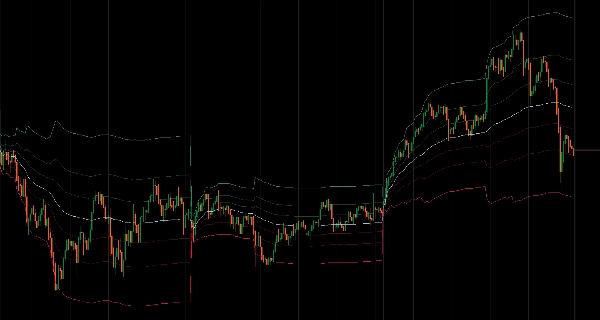
Volume Weighted Average Price with flexible reset periods and three band calculation methods.
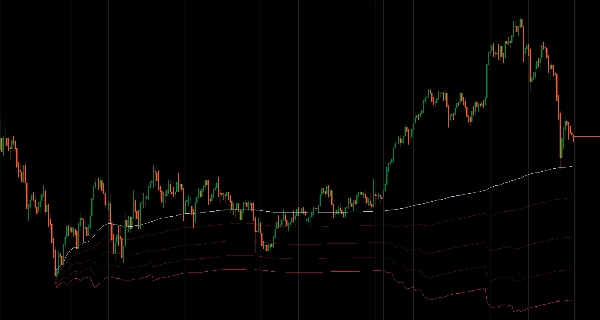
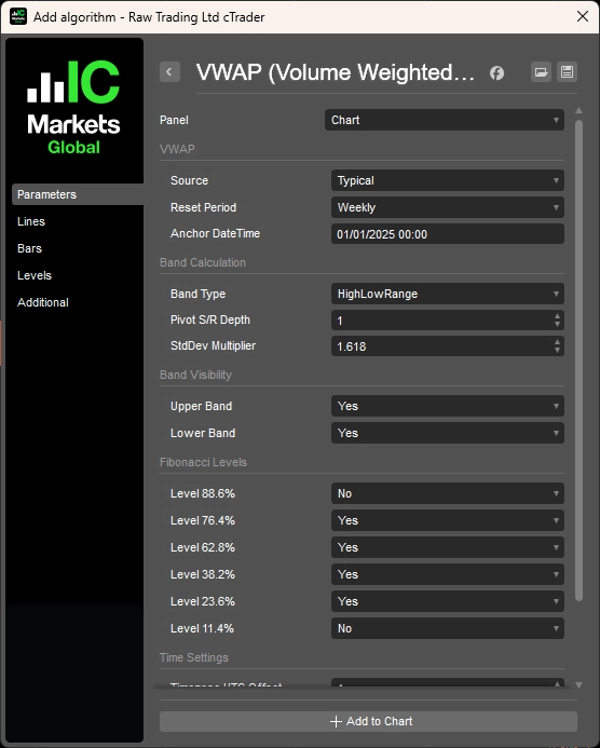
Calculates Volume Weighted Average Price with flexible reset periods including time-based intervals (daily, weekly, monthly, yearly, or custom hourly), session-based resets (Asian, London, New York with configurable start times), anchor point mode for pinning VWAP to specific events, or rolling calculation from all available data.
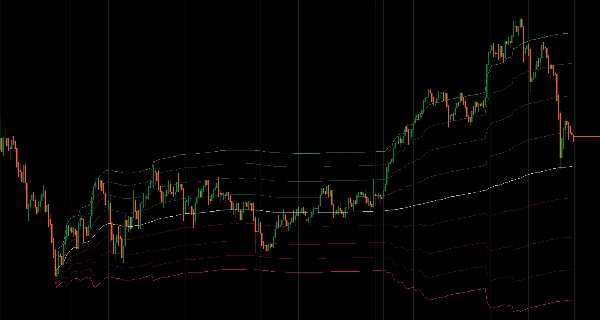
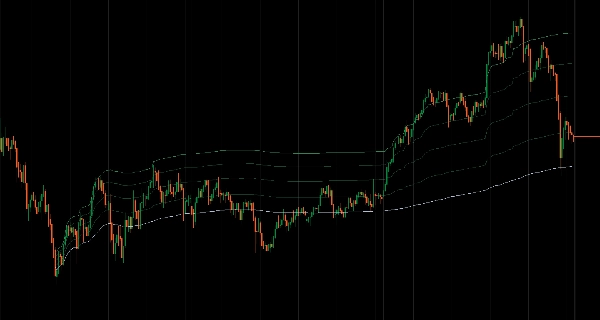
It offers three band calculation methods: High/Low Range based on previous period's price range, Fibonacci Pivot using classical pivot calculations, and Standard Deviation bands that expand and contract with volatility.
You can customize eight Fibonacci levels (100%, 88.6%, 76.4%, 62.8%, 50%, 38.2%, 23.6%, 11.4%, 0%) with individual visibility toggles and quick upper/lower band group controls. Session management includes exact start time configuration with UTC offset adjustment and timezone-aware hourly reset handling.
FEATURES
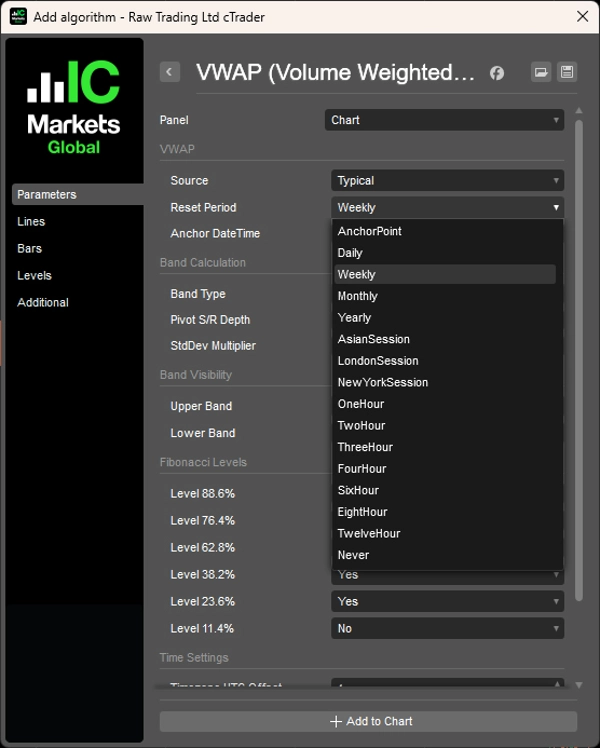
- Flexible Reset Periods
- Time-based: Daily, Weekly, Monthly, Yearly, or custom hourly intervals (1H, 2H, 3H, 4H, 6H, 8H, 12H)
- Session-based: Asian, London, New York sessions with configurable start times and timezone offsets
- Anchor Point: Pin VWAP to any specific datetime for event-driven analysis
- Rolling: Calculate from all available data without reset
- Three Band Calculation Methods
- High/Low Range: Bands based on previous period's price range
- Fibonacci Pivot: Classical pivot point calculation from previous period's H/L/C
- Standard Deviation: Traditional statistical bands that expand/contract with volatility
- Complete Fibonacci Level Control
- 8 customizable levels: 100%, 88.6%, 76.4%, 62.8%, 50% (VWAP), 38.2%, 23.6%, 11.4%, 0%
- Individual level visibility toggles
- Upper/Lower band group controls for quick adjustment
- Session Management
- Configure exact session start times with UTC offset adjustment (-12 to +14 hours)
- Visual session info display shows current reset schedule
- Timezone-aware hourly reset handling
- Performance Optimized
- Lazy calculation—bands only computed when visible
- Intelligent caching and batch processing
- Minimal CPU impact even with all levels enabled
__________________________________________________________________________________________
MORE FREE INDICATORS
Explore a wide range of market analysis tools—from structure and volume to regression, volatility, and custom timeframes.
Source code is available on GitHub repository.
All free to use. But if you feel like sending coffee support, you can route it here.
Support/Resistance
Volume
- Volume Activity Profiler
- Volume Efficiency Analyzer
- Volume Profile Analytics
- Volume Profile - Updated
- Volume Spread Analysis
- VWAP (Volume Weighted Average Price)
Moving Averages
- SSL Channel
- Anchored Moving Average
- Deviation-Scaled Moving Average
- Gann High Low Activator
- Instantaneous Trendline
- Kaufman Adaptive MA with Trend Vision
- Moving Average Channel
- Moving Averages Suite
- Trend Channel Moving Average
Utilities/Custom
Regression-Based
Volatility
Oscillators
__________________________________________________________________________________________
DISCLAIMER
Trading involves risk. This indicator is intended for technical analysis only — always apply proper risk management and trade responsibly.
FEECBACK & IMPROVEMENTS
If you have suggestions, feature requests, or ideas for enhancement, please leave a comment in the Discussion tab. Your feedback helps improve the indicator for everyone.
Summary
The indicator offers three band calculation methods: High/Low Range bands based on the previous period's price range, Fibonacci Pivot bands using classical pivot calculations, and Standard Deviation bands that adjust with market volatility. Users can customize eight Fibonacci levels (ranging from 0% to 100%) with individual visibility toggles and group controls for upper and lower bands.
Session management features include precise start time configuration with UTC offset adjustments and timezone-aware hourly resets, along with visual session information display. Performance optimizations include lazy calculation of bands only when visible, intelligent caching, and batch processing to minimize CPU usage.
Note: For forex markets, volume data represents tick volume (price change counts) rather than actual traded volume, so this indicator should be used as a measure of market activity rather than real money flow. It is intended for technical analysis with proper risk management.
Customer reviews
5 | 100 % | |
4 | 0 % | |
3 | 0 % | |
2 | 0 % | |
1 | 0 % |


!["[Stellar Strategies] Market Regime Filter" logo](https://cdn.ctrader.com/image/webp/3bdeba11-7e8b-4e5f-9af9-d562f48df039_28423)


