
Description
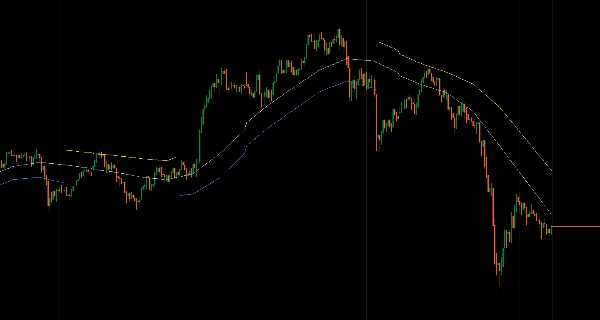
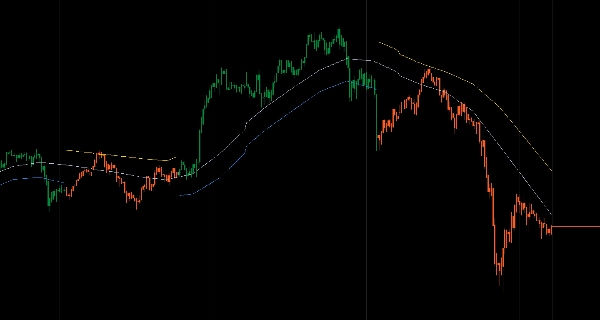
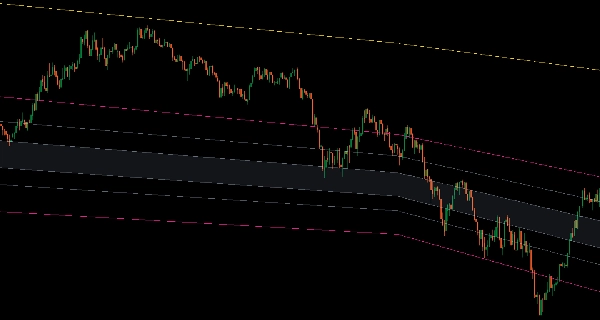
Three-color adaptive channel system using moving averages on all four OHLC prices for trend direction and structure analysis.
Displays High/Low boundaries, Open/Close directional bias lines, and Median equilibrium with color-coded trend states (Blue uptrend, Gold downtrend, Gray neutral) that adapt together.
Two display modes (full channel or trend-based clutter reduction), six optional Fibonacci zones (full channel retracements, half-channel levels, breakout extensions), 15 moving average algorithms (Arnaud Legoux, Jurik, Hull, KAMA, VIDYA, Deviation Scaled, SuperSmoother, Ultimate Smoother, McGinley Dynamic, T3, ZLEMA, Laguerre), multi-timeframe interpolation, anchor date calculation for event-based growing periods, and trend-based bar coloring deliver cohesive channel structure for traders targeting pullbacks and mean reversion within defined boundaries.
FEATURES
Three-Color Trend System
- Blue lines: Uptrend confirmed—trade pullbacks to low line
- Gold lines: Downtrend confirmed—trade bounces to high line
- Gray lines: Neutral/ranging—fade extremes, scalp the middle
- All lines adapt together—no mixed signals
Complete Channel Structure
- High/Low lines define channel boundaries
- Open/Close lines show directional bias within the channel
- Median line (center of all four) marks true equilibrium
- Integrated structure that moves cohesively
Two Display Modes
- Channel Mode: Always show both boundaries with trend colors
- Trend-Based Mode: Hide high line in uptrends, low line in downtrends—reduces visual clutter, keeps focus on tradeable boundary
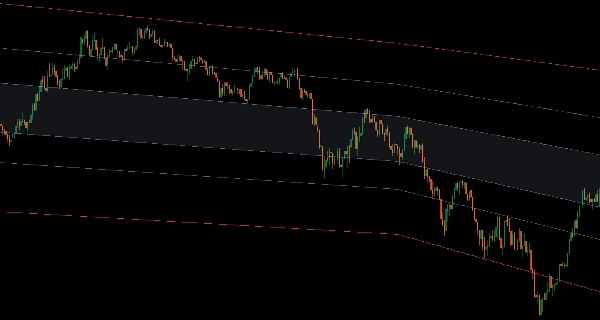
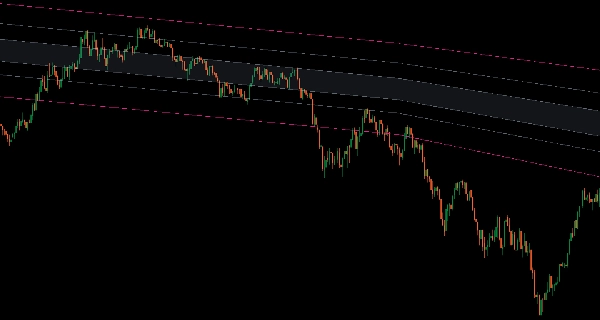
6 Fibonacci Zones (Optional)
- Between Low-High (full channel retracements)
- Between Low-Median or Median-High (half-channel levels)
- Upper/Lower extensions (breakout targets)
- Total range (lower to upper extension)
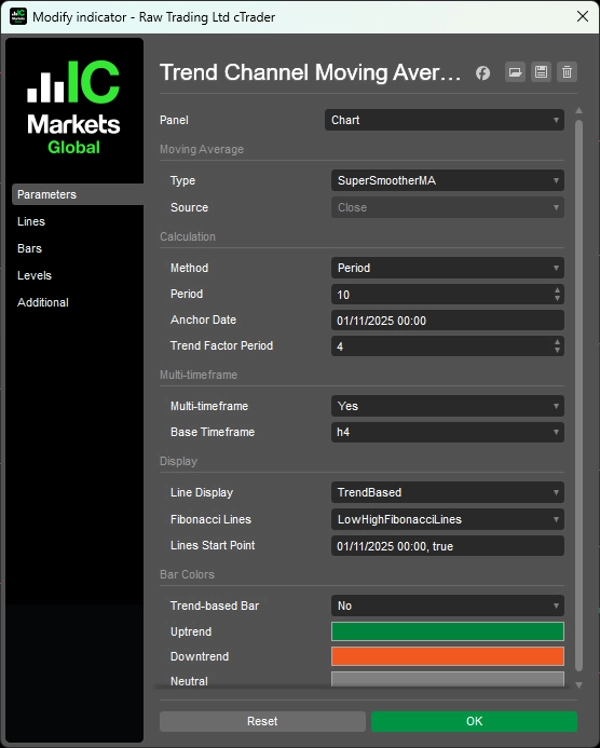
15 Moving Average Types
- Professional algorithms: Arnaud Legoux, Jurik, Hull, KAMA, VIDYA, Deviation Scaled, SuperSmoother, Ultimate Smoother, McGinley Dynamic, T3, ZLEMA, Laguerre
- Clean signals optimized for trend identification
Advanced Functionality
- Multi-timeframe mode with smooth interpolation
- Anchor date calculation (growing period from specific event/level)
- Trend-based bar coloring (optional)
- Lines start point control (hide historical data, show only recent structure)
__________________________________________________________________________________________
MORE FREE INDICATORS
Explore a wide range of market analysis tools—from structure and volume to regression, volatility, and custom timeframes.
Source code is available on GitHub repository.
All free to use. But if you feel like sending coffee support, you can route it here.
Support/Resistance
Volume
- Volume Activity Profiler
- Volume Efficiency Analyzer
- Volume Profile Analytics
- Volume Profile - Updated
- Volume Spread Analysis
- VWAP (Volume Weighted Average Price)
Moving Averages
- SSL Channel
- Anchored Moving Average
- Deviation-Scaled Moving Average
- Gann High Low Activator
- Instantaneous Trendline
- Kaufman Adaptive MA with Trend Vision
- Moving Average Channel
- Moving Averages Suite
- Trend Channel Moving Average
Utilities/Custom
Regression-Based
Volatility
Oscillators
__________________________________________________________________________________________
DISCLAIMER
Trading involves risk. This indicator is intended for technical analysis only — always apply proper risk management and trade responsibly.
FEECBACK & IMPROVEMENTS
If you have suggestions, feature requests, or ideas for enhancement, please leave a comment in the Discussion tab. Your feedback helps improve the indicator for everyone.
Summary
Key features include two display modes—full channel and trend-based clutter reduction—and six optional Fibonacci zones covering full and half-channel retracements plus breakout extensions. The system supports 15 professional moving average algorithms such as Arnaud Legoux, Jurik, Hull, KAMA, VIDYA, and others, optimized for clean trend identification. Additional functionalities include multi-timeframe interpolation, anchor date calculation for event-based periods, trend-based bar coloring, and control over line start points to focus on recent data.
This indicator is designed to help traders identify pullbacks and mean reversion opportunities within defined channel boundaries, enhancing decision-making in various market conditions.
Customer reviews
5 | 100 % | |
4 | 0 % | |
3 | 0 % | |
2 | 0 % | |
1 | 0 % |


