Description
OVERVIEW
The Instantaneous Trendline is a technical indicator developed by John Ehlers, an electrical engineer who applied digital signal processing (DSP) principles to financial market analysis. Originally published in Stocks & Commodities magazine (February 2002) and detailed in his books "Rocket Science for Traders" and "Cybernetic Analysis for Stocks and Futures", this indicator isolates the trend component of price data by filtering out cyclical (oscillating) components.
CONCEPT
Unlike traditional moving averages that simply smooth price data, the Instantaneous Trendline uses mathematical techniques derived from electrical engineering to decompose price action into two distinct components:
- Trend Component - The directional bias of the market
- Cycle Component - The oscillating fluctuations around the trend
By applying notch filters and the Hilbert Transform methodology, Ehlers created an indicator that responds quickly to genuine trend changes while filtering out noise and short-term cycles. The result is a trendline that adapts to market conditions with significantly reduced lag compared to simple or exponential moving averages of similar periods.
The core advantage of this approach is the mathematical precision in separating what is "trend" from what is "cycle noise," rather than simply averaging price over a fixed lookback period.
HOW IT WORKS
The indicator calculates a smoothed trendline using a recursive formula based on the Alpha parameter. The formula incorporates:
- Current and recent price data (HL/2 midpoint)
- Previous trendline values
- Alpha smoothing coefficient (default 0.07)
The indicator also generates a Trigger line, which is the Instantaneous Trendline displaced by 2 bars. This trigger line is used to generate trading signals through crossover logic.
INTERPRETATION
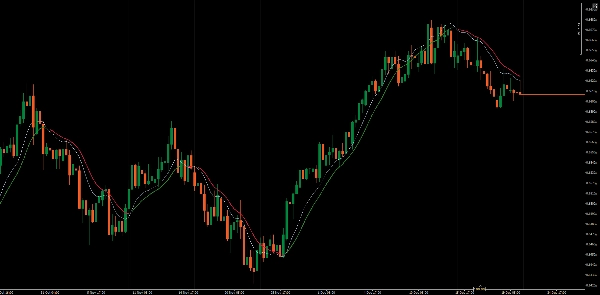
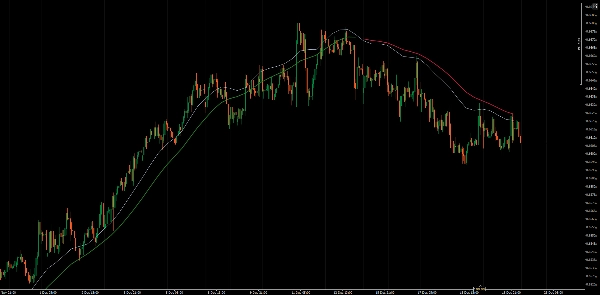
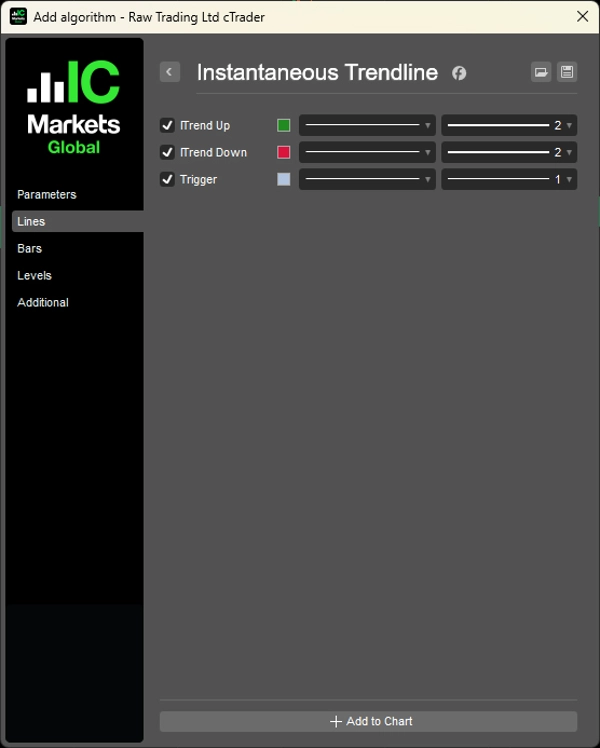
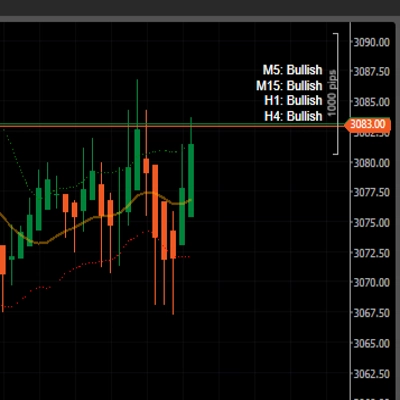
The indicator plots three lines:
- ITrend Up: Shown when Trigger > ITrend, indicating bullish conditions
- ITrend Down: Shown when Trigger < ITrend, indicating bearish conditions
- Trigger: The 2-bar delayed version of the trendline
Signal Generation:
- Bullish Signal: When the Trigger line crosses above the Instantaneous Trendline
- Bearish Signal: When the Trigger line crosses below the Instantaneous Trendline
The color-coded display makes it easy to identify the current trend direction at a glance.
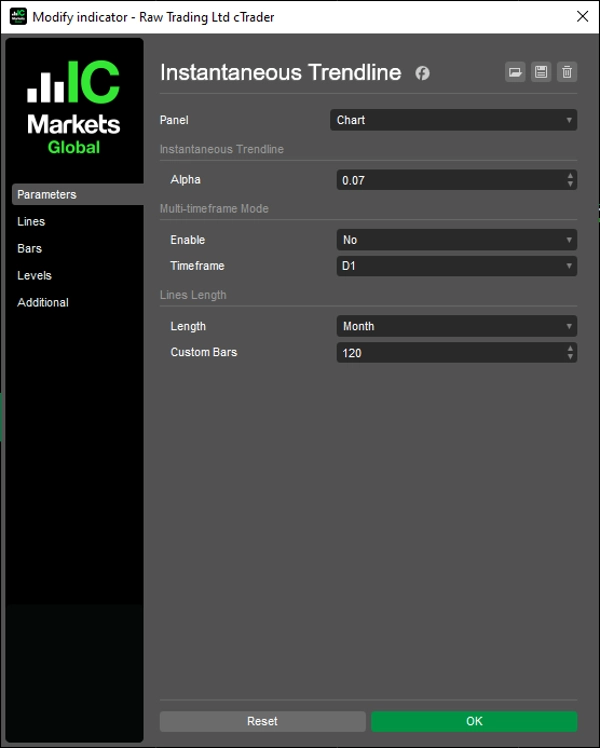
KEY PARAMETERS
Alpha (0.01 - 1.0, default 0.07)
Controls the smoothing and responsiveness of the trendline. Lower values produce smoother, slower-responding trendlines suitable for longer-term trends. Higher values increase sensitivity to price changes but may generate more false signals in choppy markets. The default value of 0.07 balances responsiveness with noise filtering.
Lines Length (default 120)
Determines how many bars of historical trendline data are displayed on the chart. This helps keep the chart clean while maintaining sufficient context.
LIMITATIONS
- Like all trend-following tools, the Instantaneous Trendline can produce whipsaws (false signals) in ranging, sideways markets
- During strong trends, the indicator may keep you in the trend longer, but you may miss the exact top or bottom
- Performance varies significantly depending on market conditions (trending vs. ranging)
- The indicator is reactive, not predictive - it identifies trends after they have begun
__________________________________________________________________________________________
MORE FREE INDICATORS
Explore a wide range of market analysis tools—from structure and volume to regression, volatility, and custom timeframes.
Source code is available on GitHub repository.
All free to use. But if you feel like sending coffee support, you can route it here.
Support/Resistance
Volume
- Volume Activity Profiler
- Volume Efficiency Analyzer
- Volume Profile Analytics
- Volume Profile - Updated
- Volume Spread Analysis
- VWAP (Volume Weighted Average Price)
Moving Averages
- SSL Channel
- Anchored Moving Average
- Deviation-Scaled Moving Average
- Gann High Low Activator
- Instantaneous Trendline
- Kaufman Adaptive MA with Trend Vision
- Moving Average Channel
- Moving Averages Suite
- Trend Channel Moving Average
Utilities/Custom
Regression-Based
Volatility
Oscillators
__________________________________________________________________________________________
DISCLAIMER
Trading involves risk. This indicator is intended for technical analysis only — always apply proper risk management and trade responsibly.
FEECBACK & IMPROVEMENTS
If you have suggestions, feature requests, or ideas for enhancement, please leave a comment in the Discussion tab. Your feedback helps improve the indicator for everyone.
Summary
The indicator calculates a smoothed trendline based on recent price midpoints and prior trendline values, controlled by an adjustable Alpha parameter (default 0.07) that balances responsiveness and noise filtering. It also generates a Trigger line, which is the trendline displaced by two bars, used to identify bullish and bearish signals via crossovers.
Displayed on the chart are three lines: the Instantaneous Trendline, the Trigger line, and color-coded trend states indicating bullish or bearish conditions. The indicator supports multiple markets including Forex, indices, commodities, cryptocurrencies, and stocks.
Key parameters include Alpha for smoothing and Lines Length for historical data display. The Instantaneous Trendline is reactive, identifying trends after they begin, and is designed to reduce lag and filter cycle noise for clearer trend analysis.
Customer reviews
5 | 100 % | |
4 | 0 % | |
3 | 0 % | |
2 | 0 % | |
1 | 0 % |


!["High-Low Divergence [Iridio Capital]" logo](https://cdn.ctrader.com/image/webp/443c4661-7abb-40f1-842f-4b6ec560649b_40914)