
Açıklama
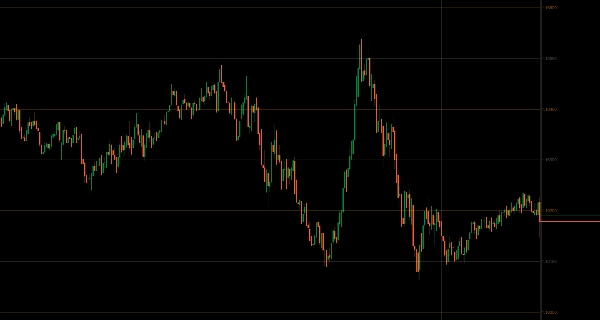
Mevcut fiyat etrafında otomatik merkezlenmiş psikolojik seviyeler ve çift-çoklu gösterim sistemi.
Fiyat hareket ettikçe birincil ve alternatif yuvarlak sayı seviyelerini (ayar yapılabilir pip/puan) dinamik olarak projelendirir, manuel ayar yapmadan bağlamsal alaka düzeyini korur.
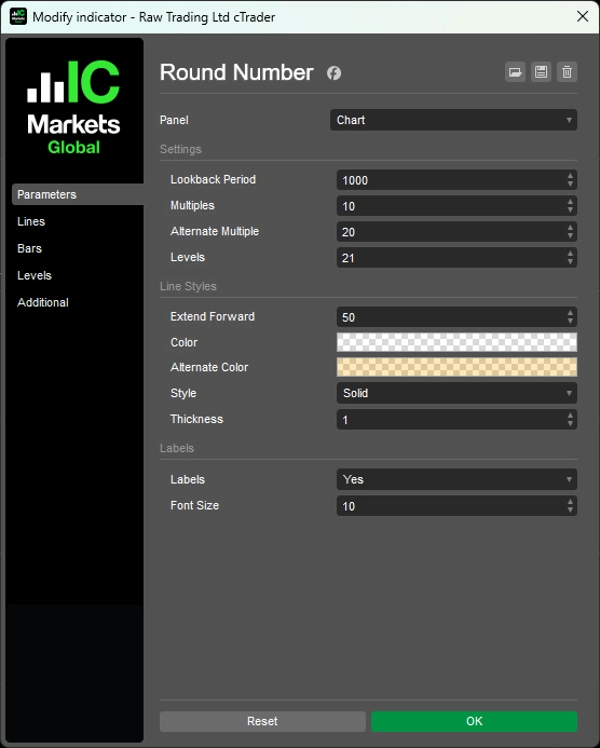
Görsel hiyerarşi için çift-çoklu sistem (varsayılan 10/20 pip), tarihsel aralıkla geriye dönük doğrulama (varsayılan 1000 bar), fiyat merkezli ayarlanabilir seviye sayısı (varsayılan 21), yazı tipi boyutu kontrolü ile isteğe bağlı fiyat etiketleri ve özelleştirilebilir mesafeyle ileri projeksiyon, tüm zaman dilimlerinde doğal destek/direnç ve emir küme bölgelerini hedefleyen traderlar için otomatik psikolojik seviye takibi sağlar.
ÖZELLİKLER
Otomatik Merkezlenmiş Gösterim
- Her zaman mevcut fiyat etrafında ilgili seviyeleri gösterir—manuel ayar gerekmez
- Dinamik yeniden hesaplama: Seviyeleri bağlamsal olarak ilgili tutmak için fiyat hareket ettikçe günceller
- Akıllı uzatma: Seviyeleri özelleştirilebilir mesafe ile ileriye projelendirir
Çift-Çoklu Sistem
- Standart bölgeler için birincil seviyeler (varsayılan 10 pip)
- Ana bölgeler için alternatif seviyeler (varsayılan 20 pip)
- Birincil ve ana seviyeler arasında görsel hiyerarşi için iki renkli sistem
- Ayar yapılabilir katlar (pip, puan veya enstrümana bağlı dolar)
Geriye Dönük Doğrulama
- Seviyelerin bağlamsal olarak ilgili olmasını sağlamak için tarihsel aralık kullanır (varsayılan 1000 bar)
- Seviye yerleşimini fiyat geçmişine karşı doğrular
- Farklı piyasa koşulları arasında alaka düzeyini korur
Özelleştirme
- Fiyat merkezli ayarlanabilir seviye sayısı (varsayılan 21)
- Ayarlanabilir yazı tipi boyutuyla isteğe bağlı fiyat etiketleri
- Tam stil kontrolü: renk, kalınlık, çizgi stili
- Manuel çizgi çizimi olmadan temiz sunum
Çoklu Zaman Dilimi Kullanımı
- Aynı seviyeler tüm zaman dilimlerinde önemlidir
- Scalping, günlük işlem ve swing trading için uygundur
- Doğal destek/direnç ve kurumsal bölgeler
__________________________________________________________________________________________
DAHA FAZLA ÜCRETSİZ GÖSTERGE
Yapı ve hacimden regresyon, volatilite ve özel zaman dilimlerine kadar geniş bir piyasa analiz araçları yelpazesini keşfedin.
Kaynak kodu GitHub deposunda mevcuttur.
Tamamen ücretsizdir. Ancak kahve desteği göndermek isterseniz, buradan yapabilirsiniz.
Destek/Direnç
Hacim
- Hacim Aktivite Profili
- Hacim Verimlilik Analizörü
- Hacim Profili Analitiği
- Hacim Profili - Güncellenmiş
- Hacim Yayılım Analizi
- VWAP (Hacim Ağırlıklı Ortalama Fiyat)
Hareketli Ortalamalar
- SSL Kanalı
- Çapa Hareketli Ortalama
- Sapma Ölçekli Hareketli Ortalama
- Gann Yüksek Düşük Aktivator
- Anlık Trend Çizgisi
- Trend Vizyonlu Kaufman Adaptif MA
- Hareketli Ortalama Kanalı
- Hareketli Ortalamalar Paketi
- Trend Kanalı Hareketli Ortalama
Araçlar/Özel
Regresyon Tabanlı
Volatilite
Osilatörler
__________________________________________________________________________________________
FERAGATNAME
Ticaret risk içerir. Bu gösterge yalnızca teknik analiz amaçlıdır — her zaman uygun risk yönetimi uygulayın ve sorumlu şekilde işlem yapın.
GERİ BİLDİRİM & GELİŞTİRMELER
Önerileriniz, özellik talepleriniz veya geliştirme fikirleriniz varsa, lütfen Tartışma sekmesinde yorum bırakın. Geri bildiriminiz göstergenin herkes için iyileştirilmesine yardımcı olur.
Özet
Müşteri değerlendirmeleri
5 | 100 % | |
4 | 0 % | |
3 | 0 % | |
2 | 0 % | |
1 | 0 % |


