
Series - FXMaster
مؤشر
3 عمليات الشراء
الإصدار 1.0، Jul 2025
Windows, Mac
4.6
التقييمات: 3

الوصف
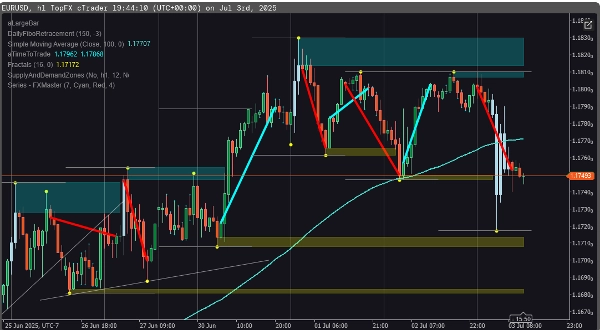
اكتشف الاتجاهات ذات الاحتمالية العالية بدقة. مؤشر خطوط الاتجاه متعددة الرموز يكتشف سلسلة من القمم الأعلى / القيعان الأعلى / الإغلاقات العالية أو القيعان الأدنى / القمم الأدنى / الإغلاقات المنخفضة، مما يمنحك رؤية واضحة وقابلة للتخصيص للاتجاهات الصاعدة والهابطة—عبر أي رمز سوق.
🚀 الميزات الرئيسية
- كشف تسلسل الاتجاه: اكتشف تسلسلات صاعدة أو هابطة بناءً على أنماط هيكل السعر المتتالية.
- عوائق قابلة للتخصيص: حدد عدد الأشرطة اللازمة لتأكيد اتجاه صالح—اضبطها لتتناسب مع استراتيجيتك.
- خطوط اتجاه بصرية: يرسم خطوط الاتجاه تلقائيًا مباشرة على الرسم البياني الخاص بك—ملونة للاتجاهات الصاعدة والهابطة.
🎯 لمن هذا
- متداولو حركة السعر الذين يعتمدون على الهيكل والإيقاع بدلاً من المؤشرات.
- متابعو الاتجاه الباحثون عن تأكيد مبكر للهيكل.
- مراقبو الرموز المتعددة الذين يحتاجون إلى أداة واحدة تحكمهم جميعًا.
الملخص
ملخص الذكاء الاصطناعي
The Series - FXMaster indicator identifies high-probability trends by detecting sequences of price action patterns such as Higher Highs, Higher Lows, High Closes, Lower Lows, Lower Highs, and Low Closes. It provides clear, customizable insights into uptrends and downtrends across any market symbol, including Forex, indices, commodities, cryptocurrencies, and stocks. Key features include trend sequence detection to spot bullish or bearish patterns based on consecutive price structures, customizable thresholds allowing users to set the number of bars required to confirm a trend, and automatic drawing of color-coded trendlines directly on charts for visual clarity. This tool is designed for price action traders who prioritize market structure and rhythm, trend followers seeking early confirmation of trends, and multi-symbol watchers who require a unified indicator for multiple markets.
ملف تعريف المؤشر
تقييمات العملاء
4.6
التقييمات: 3
5 | 67 % | |
4 | 33 % | |
3 | 0 % | |
2 | 0 % | |
1 | 0 % |
تقييمات العملاء
July 14, 2025
The opening read should not drive the whole decision, but it is just a support layer.
July 8, 2025
The journal has a cleaner path, but it works better with a written plan.
مناقشة
الأسئلة الشائعة
Forex
Indices
Commodities
Crypto
Stocks
يتم توفير المنتجات المتاحة من خلال cTrader Store، بما في ذلك روبوتات التداول والمؤشرات والإضافات، من قبل مطوري الطرف الثالث وإتاحتها لأغراض الوصول المعلوماتي والفني فقط. cTrader Store ليس وسيطًا ولا يقدم نصائح استثمارية أو توصيات شخصية أو أي ضمان للأداء المستقبلي.


السعر
منذ 11/01/2025
19
المبيعات