
الوصف
🔧 ATR_RR_SignalPanel — الوصف الفني والتفصيلي (EN) 🧠📈
ATR_RR_SignalPanel هو مؤشر تراكبي لـ cTrader يولد إشارات دخول تغير الاتجاه باستخدام نظام EMA السريع مقابل EMA البطيء، ثم يبني إطار عمل تجارة افتراضية كاملة (الدخول 🏁، وقف الخسارة 🛑، جني الأرباح النهائي 🎯، الأهداف الوسيطة 🟢) باستخدام تحديد حجم المخاطرة بناءً على ATR ومضاعف نسبة المخاطرة إلى المكافأة القابل للتكوين ⚖️.
🧭 المنطق الأساسي (محرك الإشارة) 🚦
- يقوم المؤشر بحساب:
-
- EMA السريع ⚡ وEMA البطيء 🐢 على الإغلاق.
- ATR (تنعيم وايلدر) 🌡️ لمسافة وقف الخسارة بناءً على التقلب.
- يتم تعريف نظام الاتجاه كما يلي:
-
- اتجاه صاعد 🟢 عندما
Fast EMA > Slow EMA - اتجاه هابط 🔴 عندما
Fast EMA < Slow EMA
- اتجاه صاعد 🟢 عندما
- يتم تفعيل تغير الاتجاه 🔁 عندما يختلف حالة الصعود/الهبوط عن الشمعة السابقة (ما يعادل في باين
bullTrend != bullTrend[1]).
🎯 شروط الدخول (شراء/بيع) 🟩🟥
عندما يحدث تغير في الاتجاه:
- إشارة شراء 🟢 إذا:
-
- يكون الاتجاه الصاعد نشط و يتم اكتشاف تغير في الاتجاه
- تأكيد شمعة اختياري ✅: الإغلاق > الافتتاح (شمعة صاعدة)
- إشارة بيع 🔴 إذا:
-
- يكون الاتجاه الهابط نشط و يتم اكتشاف تغير في الاتجاه
- تأكيد شمعة اختياري ✅: الإغلاق < الافتتاح (شمعة هابطة)
🧪 إدارة المراكز الافتراضية (ليس cBot) 🧩
هذا المؤشر لا يضع أوامر. بدلاً من ذلك يحاكي “مركز افتراضي” داخلي:
- عند وجود إشارة شراء/بيع جديدة يحدد:
-
- سعر الدخول = الإغلاق الحالي 🏁
- وقف الخسارة = أقصى نقطة في الشمعة ± ATR × المضاعف 🛑
- جني الأرباح النهائي = الدخول ± (المخاطرة × نسبة المخاطرة إلى المكافأة) 🎯
- مستويات جني الأرباح الوسيطة = خطوات عند 1R، 2R، … حتى floor(RR)-1 🟢
- يراقب حركة السعر شمعة تلو الأخرى:
-
- إذا تم لمس جني الأرباح النهائي ➜ يتم وضع علامة 🎯 ويغلق المركز الافتراضي ✅
- إذا تم لمس وقف الخسارة ➜ يتم وضع علامة 🛑 ويغلق المركز الافتراضي ❌
- يتم تتبع ضربات جني الأرباح الوسيطة مرة واحدة فقط 🧷
🔁 منطق الإلغاء (إشارة معاكسة أثناء التفعيل) ⚠️
إذا وصلت إشارة جديدة بينما يوجد مركز افتراضي في الاتجاه المعاكس:
- يتم وضع علامة على الدخول السابق كـ ملغى ⚠️ (INV شراء / INV بيع)
- يتم إنهاء المركز الافتراضي السابق 🧯
- يتم إنشاء مركز افتراضي جديد في الاتجاه الجديد 🔄
🧼 آمن متعدد النسخ (نسخ متعددة على نفس الرسم البياني) 🧩🧩
كل نسخة من المؤشر تولد معرف داخلي فريد 🆔، لذا:
- الخطوط/النصوص من نسخة واحدة لن تكتب فوق نسخة أخرى ✅
- يمكنك تشغيل عدة إعدادات متوازية (مثلاً، سكالبينج + سوينغ) 🧠📊
🧯 ضوابط مكافحة الفوضى (محدد العلامات) 🧹✨
للحفاظ على وضوح الرسوم البيانية، يمكنه:
- تحديد عدد علامات النص المرسومة (شراء/بيع/جني أرباح/وقف خسارة/إلغاء/TP1…) 🧾
- حذف العلامات الأقدم تلقائياً عند تجاوز الحد ♻️
🧷 خيار “الاحتفاظ بآخر خطوط المخاطرة” 🧠📌
عند التفعيل، تبقى خطوط الدخول/وقف الخسارة/جني الأرباح الأخيرة مرئية حتى بعد إغلاق TP/SL:
- مفيد جداً لمراجعة ما بعد التداول 🧑🔬
- مفيد جداً للتوثيق 📒✅
⚙️ المعلمات — شرح تفصيلي (EN) 🔍📌
📈 جوهر الإشارة والمخاطرة
⚡ EMA السريع
- ما يفعله 🧠: يحدد فترة EMA السريع المستخدمة لاكتشاف تغيرات النظام.
- التأثير 📊: القيم الأقل = استجابة أسرع ➜ إشارات أكثر؛ القيم الأعلى = أكثر سلاسة ➜ إشارات أقل.
- النطاقات النموذجية 🎛️: 3–10 للأسواق السريعة ⚡، 10–20 للإعدادات الأهدأ 🐢
🐢 EMA البطيء
- ما يفعله 🧠: يحدد فترة EMA البطيء المستخدمة كأساس للاتجاه.
- التأثير 📊: EMA البطيء الأعلى = ترشيح أقوى ➜ عدد أقل من تفعيل تغير الاتجاه.
- النطاقات النموذجية 🎛️: 13–55 حسب الأسلوب 🧭
🌡️ فترة ATR
- ما يفعله 🧠: يتحكم في طول قياس التقلب لـ ATR.
- التأثير 📏: ATR القصير يستجيب بسرعة (وقف خسارة أضيق)، ATR الطويل يستقر (وقف خسارة أكثر ثباتاً).
- النطاقات النموذجية 🎛️: 10–21 شائع ✅
🛑 مضاعف وقف الخسارة (ATR)
- ما يفعله 🧠: يحدد مسافة وقف الخسارة بوحدات ATR.
- طويل 🟢:
SL = Low - ATR * Mult - قصير 🔴:
SL = High + ATR * Mult - التأثير 🎯: المضاعف الأعلى = وقف خسارة أوسع (توقفات أقل، مخاطرة أكبر)؛ المضاعف الأقل = وقف خسارة أضيق (توقفات أكثر).
- القيم النموذجية 🎛️: 0.3–2.0 حسب التقلب 🌪️
⚖️ نسبة المخاطرة إلى المكافأة (R:R)
- ما يفعله 🧠: يضرب مسافة “المخاطرة” لحساب جني الأرباح النهائي.
- الصيغة 📌:
-
- المخاطرة = |الدخول − وقف الخسارة|
- جني الأرباح النهائي = الدخول ± المخاطرة × RR 🎯
- جني أرباح وسيطة 🟢: TP1 عند 1R، TP2 عند 2R، … حتى
floor(RR)-1 - مثال 🧪: RR=3 ➜ TP1 (1R)، TP2 (2R)، جني الأرباح النهائي (3R) 🎯🎯🎯
✅ يتطلب تأكيد الشمعة
- ما يفعله 🧠: يضيف تحقق اتجاه الشمعة على شمعة الإشارة.
- شراء 🟢: يتطلب الإغلاق > الافتتاح
- بيع 🔴: يتطلب الإغلاق < الافتتاح
- التأثير 🧽: يفلتر التقلبات الضعيفة، يقلل الضوضاء، قد يدخل متأخراً ⏳
📌 عرض EMAs
👁️ إظهار EMA السريع
- ما يفعله 🧠: يعرض/يخفي خط EMA السريع.
- حالة الاستخدام 💡: أخفِ إذا كنت تريد رسم بياني نظيف 🧼
👁️ إظهار EMA البطيء
- ما يفعله 🧠: يعرض/يخفي خط EMA البطيء.
- حالة الاستخدام 💡: ابق مرئياً لسياق الاتجاه 🧭
🎛️ ضوابط بصرية (إدارة الفوضى) 🧹✨
🚦 إظهار الإشارات
- ما يفعله 🧠: يعرض/يخفي علامات الشراء/البيع.
- يشمل 🧷: علامات شراء 🟢 / بيع 🔴 فقط
- نصيحة 💡: عطلها لوضع “الخطوط فقط” 📏
🏷️ إظهار تسميات جني الأرباح
- ما يفعله 🧠: يعرض/يخفي التسميات مثل TP1، TP2…
- التأثير 🧼: إيقاف التشغيل يزيل الكثير من ضوضاء النص على الأطر الزمنية الأعلى 📉
- ملاحظة 🧷: تظهر التسميات مرة واحدة فقط لكل ضربة TP ✅
⚠️ إظهار علامات الإلغاء
- ما يفعله 🧠: يعرض/يخفي علامات INV شراء / INV بيع.
- حالة الاستخدام 🧠: مفيد عندما تريد دراسة انعكاسات الإشارة 🔁
🎯🛑 إظهار علامات جني الأرباح النهائي/وقف الخسارة
- ما يفعله 🧠: يعرض/يخفي علامات جني الأرباح النهائي ووقف الخسارة.
- حالة الاستخدام 📒: رائع لمراجعة توزيع النتائج 🎲
📏 إظهار خطوط المخاطرة (الدخول/وقف الخسارة/جني الأرباح)
- ما يفعله 🧠: يرسم خطوط الدخول 🏁، وقف الخسارة 🛑، جني الأرباح النهائي 🎯 على الرسم البياني.
- التأثير 📌: يصور هيكل التجارة الافتراضية فوراً 🧠
🟢 إظهار خطوط جني الأرباح الوسيطة
- ما يفعله 🧠: يرسم خطوط منقطه لمستويات TP1/TP2/...
- نصيحة 🧼: عطلها إذا أصبح الرسم البياني “سباغيتي أخضر” كثيراً 🍝🟢
📌 الاحتفاظ بآخر خطوط المخاطرة
- ما يفعله 🧠: يحتفظ بخطوط الدخول/وقف الخسارة/جني الأرباح الأخيرة مرئية بعد الخروج الافتراضي (TP/SL).
- لماذا هو مفيد 📒: مثالي للتوثيق وتحليل ما بعد التداول 🧑🔬✅
🧾 الحد الأقصى للعلامات على الرسم البياني (0=غير محدود)
- ما يفعله 🧠: يحدد عدد كائنات النص التي يتركها المؤشر على الرسم البياني.
- كيف يعمل ♻️: عند تجاوز الحد، يتم إزالة أقدم العلامات تلقائياً.
- موصى به 🎛️: 80–200 حسب الإطار الزمني وعمق التاريخ 🕰️
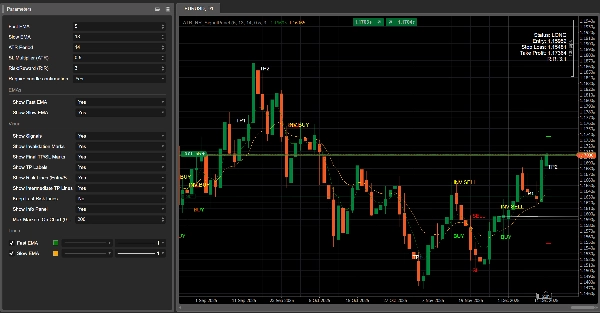
🧾 إظهار لوحة المعلومات
- ما يفعله 🧠: يعرض لوحة حالة مدمجة على الرسم البياني.
- يعرض 📋: الحالة (طويل/قصير/لا مركز)، الدخول، وقف الخسارة، جني الأرباح، نسبة المخاطرة إلى المكافأة المحسوبة.
الملخص
The indicator simulates virtual trades by setting entry price, stop loss, and take profit levels using Average True Range (ATR) for volatility-based risk sizing combined with a configurable risk-to-reward multiplier. It tracks intermediate take profit levels and monitors price action bar-by-bar to mark virtual trade outcomes without placing actual orders.
Key features include optional candle confirmation for signals, multi-instance support to run multiple configurations on the same chart, and visual clutter controls such as limiting markers and toggling display of EMAs, signals, and risk lines. An info panel provides a compact status overview of virtual positions. Parameters allow customization of EMA periods, ATR period, stop loss multiplier, and risk-reward ratio to adapt to different trading styles and market conditions.
Supported markets include Forex, indices, commodities, stocks, and cryptocurrencies, with symbols like GBPUSD, EURUSD, XAUUSD, NAS100, and BTCUSD among the tagged assets.
تقييمات العملاء
5 | 100 % | |
4 | 0 % | |
3 | 0 % | |
2 | 0 % | |
1 | 0 % |


![شعار "High-Low Divergence [Iridio Capital]"](https://cdn.ctrader.com/image/webp/443c4661-7abb-40f1-842f-4b6ec560649b_40914)
