
الوصف
دليل مستخدم WinSMC
1. الغرض
`WinSMC` هو مؤشر SMC تراكبي لمنصة cTrader. يساعدك على التعرف بصريًا على:
- تحولات هيكل السوق
- `BOS` (اختراق الهيكل)
- `MSS` (تحول هيكل السوق)
- `كتل الأوامر`
- `الاستحواذ على السيولة` / `المسح`
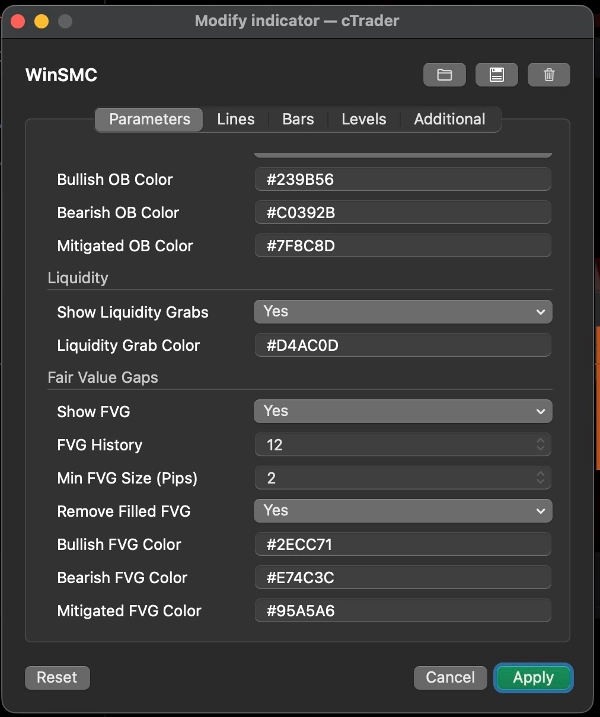
- `FVG` (فجوات القيمة العادلة)
إنه ليس نظام تداول آلي. إنه أداة هيكلية وسياقية تُستخدم بشكل أفضل للتداول المعتمد على التأكيد.
2. المفاهيم الأساسية
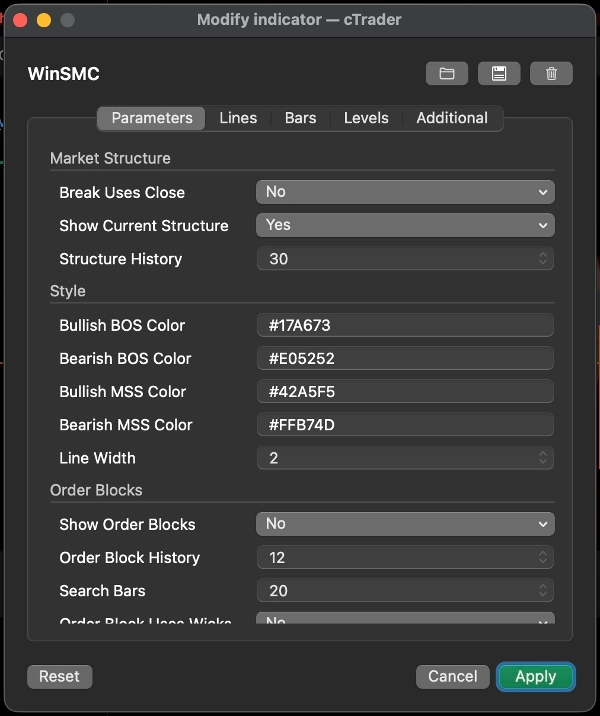
طول التأرجح
`طول التأرجح` يتحكم في مدى تأكيد نقطة المحور إلى اليسار واليمين قبل اعتبارها نقطة تأرجح صالحة.
إرشادات عملية:
- القيم الأصغر = إشارات أكثر، ضوضاء أكثر
- القيم الأكبر = إشارات أقل، هيكل أنظف
الاختراق يستخدم الإغلاق
يحدد هذا الإعداد ما إذا كان اختراق الهيكل يتم تأكيده بواسطة:
- `نعم`: إغلاق الشمعة
- `لا`: اختراق الفتيل/القاع/القمة
إرشادات:
- استخدم الإغلاق لنهج أكثر تحفظًا
- استخدم اختراقات الفتيل للكشف المبكر والأكثر حساسية
عرض الهيكل الحالي
يعرض خطوط التأرجح العليا والسفلى النشطة الحالية، مما يساعدك على رؤية ما يزال السوق يحترمه.
تاريخ الهيكل
يتحكم في عدد خطوط اختراق الهيكل والتسميات التي تبقى على الرسم البياني.
3. BOS و MSS
BOS
`BOS` تعني أن السعر يستمر في نفس الاتجاه ويخترق القمة أو القاع السابق.
التفسير النموذجي:
- في اتجاه صاعد، اختراق القمة السابقة هو BOS صاعد
- في اتجاه هابط، اختراق القاع السابق هو BOS هابط
MSS
`MSS` تعني أن السوق قد غير اتجاهه عن التحيز السابق.
التفسير النموذجي:
- إذا كان السعر هابطًا واخترق قمة سابقة، فهذا MSS صاعد
- إذا كان السعر صاعدًا واخترق قاعًا سابقًا، فهذا MSS هابط
الاستخدام في التداول
- `BOS` يركز أكثر على استمرار الاتجاه
- `MSS` يركز أكثر على الانعكاس
- أفضل نقاط الدخول عادة تأتي من إعادة اختبار `كتلة أمر` أو `FVG`
4. كتل الأوامر
`كتلة الأمر` هي آخر شمعة معاكسة قبل اختراق الهيكل. تُعامل عادة كمنطقة تفاعل العرض/الطلب.
عرض كتل الأوامر
عند التفعيل، ينظر المؤشر إلى الوراء بعد `BOS` أو `MSS` ويرسم منطقة آخر شمعة معاكسة.
المعنى
- كتلة أمر صاعدة: بعد اختراق صاعد، تُستخدم آخر شمعة هابطة
- كتلة أمر هابطة: بعد اختراق هابط، تُستخدم آخر شمعة صاعدة
عندما يبدأ السعر بالتفاعل مع المنطقة، يتم تمييزها كمخففة.
كتلة الأمر تستخدم الفتيول
هذا يتحكم في مدى عرض الصندوق المرسوم:
- `نعم`: استخدم نطاق الشمعة الكامل، منطقة أوسع
- `لا`: استخدم منطقة مركزية أضيق
إرشادات:
- استخدم `نعم` لمنطقة أوسع وأكثر تحفظًا
- استخدم `لا` لمنطقة أضيق وأكثر دقة
استراتيجية كتلة الأمر
سير العمل الشائع:
1. انتظر `BOS` أو `MSS`
2. علم كتلة الأمر المقابلة
3. انتظر إعادة الاختبار
4. ابحث عن التأكيد قبل الدخول
لا تعامل كتلة الأمر كنقطة انعكاس مضمونة. إنها منطقة ذات اهتمام عالي، وليست يقينًا.
5. الاستحواذ على السيولة / المسح
`الاستحواذ على السيولة` يعني أن السعر يرتفع فوق قمة سابقة أو ينخفض تحت قاع سابق، ثم يغلق داخل النطاق مرة أخرى.
في هذا المؤشر:
- `مسح جانب الشراء`: السعر يأخذ القمة السابقة ويغلق أدناها
- `مسح جانب البيع`: السعر يأخذ القاع السابق ويغلق أعلاه
هذا عادة يعني أن السوق استحوذ على السيولة وقد يكون يستعد للحركة التالية.
مهم
المسح وحده ليس إشارة تداول.
من الأفضل اعتباره:
- تحذير بأن السيولة قد تم أخذها
- تلميح لإعداد الصفقة
- سبب للانتظار لـ `MSS` أو `BOS`
الاستخدام الشائع
- بعد `مسح جانب الشراء`، يمكن لـ `MSS` هابط دعم إعداد بيع
- بعد `مسح جانب البيع`، يمكن لـ `MSS` صاعد دعم إعداد شراء
6. FVG
`FVG` هي فجوة القيمة العادلة التي تنشأ من عدم توازن في ثلاث شموع.
عرض FVG
عند التفعيل، يرسم المؤشر مناطق FVG المرئية.
قاعدة الكشف
- FVG صاعد: قمة الشمعة الأولى تحت قاع الشمعة الثالثة
- FVG هابط: قاع الشمعة الأولى فوق قمة الشمعة الثالثة
الحد الأدنى لحجم FVG (نقاط)
هذا يفلتر الفجوات الصغيرة جدًا.
- الوحدة: `نقاط`
- قيمة أعلى = عدد أقل ولكن FVGs أكثر معنى
- `0` = لا فلتر للحجم
مفيد عندما يكون الرسم البياني مزدحمًا أو عندما لا تكون الفجوات الصغيرة 1 بكسل مفيدة لسير عملك.
إزالة FVG المملوءة
عند التفعيل، تتم إزالة FVGs المملوءة بالكامل من الرسم البياني.
استراتيجية FVG
نهجان شائعان:
1. ارتداد الاتجاه
- انتظر `BOS` أو `MSS`
- انتظر السعر ليعود إلى FVG
- تداول في اتجاه الهيكل
2. دخول معتمد على التأكيد
- راقب المسح
- انتظر `MSS`
- استخدم FVG كمنطقة الارتداد النهائية
7. أنماط التداول الموصى بها
الاستراتيجية أ: استمرار الاتجاه
الأفضل عندما يكون السوق في اتجاه واضح.
سير العمل:
1. انتظر `BOS`
2. علم كتلة الأمر
3. ابحث عن ارتداد إلى OB أو FVG
4. ادخل فقط بعد رد فعل السعر
هذا نهج كلاسيكي لمتابعة الاتجاه.
الاستراتيجية ب: المسح ثم الانعكاس
الأفضل عندما يكون السوق متقلبًا وعرضة للاختراقات الكاذبة.
سير العمل:
1. اكتشف `مسح جانب الشراء` أو `مسح جانب البيع`
2. انتظر `MSS` المعاكس
3. استخدم OB أو FVG كمنطقة ارتداد
4. ادخل بعد التأكيد
هذا أقوى من التداول على المسح وحده.
الاستراتيجية ج: تلاقي المسح + MSS + OB/FVG
هذه واحدة من أنظف الطرق لاستخدام المؤشر.
سير العمل:
1. الحصول على مسح
2. الحصول على MSS
3. انتظر إعادة اختبار OB أو FVG
4. تداول فقط عندما تتداخل المناطق
هذا يقلل من الدخول المبكر.
8. اقتراحات الإعداد السريعة
- `طول التأرجح`: ابدأ بـ 5 أو 7
- `الاختراق يستخدم الإغلاق`: فعّل لرؤية أكثر تحفظًا
- `كتلة الأمر تستخدم الفتيول`: فعّل لمناطق أوسع
- `الحد الأدنى لحجم FVG (نقاط)`: ابدأ بـ 2.0 واضبط حسب الأداة
- `تاريخ الهيكل` / `تاريخ كتلة الأمر` / `تاريخ FVG`: اضبط للحفاظ على قابلية قراءة الرسم البياني
9. ملاحظة نهائية
`WinSMC` يُستخدم بشكل أفضل كخريطة هيكلية، وليس كمحفز إشارة واحدة.
سير العمل الأكثر موثوقية هو:
- تحديد اتجاه الاتجاه
- مراقبة مسح السيولة
- الانتظار لـ MSS أو BOS
- استخدام OB أو FVG كمنطقة دخول
- الدخول فقط بعد التأكيد
الملخص
The indicator helps traders analyze price action by marking swing highs and lows, confirming valid swing points based on customizable swing length, and distinguishing breaks using candle closes or wick extremes. Order Blocks are displayed as supply/demand zones derived from the last opposite candle before a structure break, with options to adjust zone width. Liquidity Sweeps indicate price movements beyond prior highs or lows that close back inside, signaling potential setups rather than direct trade signals. FVG zones are identified by three-candle imbalances and can be filtered by minimum size and removed once filled.
WinSMC supports multiple trading strategies, including trend continuation after BOS, reversal setups following liquidity sweeps and MSS, and confluence-based entries combining sweeps, MSS, and retests of Order Blocks or FVGs. It is intended as a confirmation and structure mapping tool rather than an automated trading system, aiding traders in timing entries with contextual market information.

![شعار "[CB] Pivot Points Pro"](https://cdn.ctrader.com/image/webp/43463c82-67b0-4f10-a4ba-901bba091d81_32594)


