
说明
ICT Killzones 完整版 – 专业交易时段分析
使用最全面的 cTrader ICT Killzones 指标掌握机构交易时机。这个专业级工具自动识别并可视化所有五个关键的 ICT(Inner Circle Trader)交易时段,让您能够与聪明资金同步交易,获得优势。
本版本新功能:
- 全部 5 个 ICT 时段:完整覆盖亚洲区间、伦敦杀戮区、纽约杀戮区、纽约午餐/反转区和纽约下午杀戮区
- 智能颜色系统:使用简单颜色名称(红色、蓝色、橙色),替代复杂的 ARGB 代码
- 独立透明度控制:可调节每个时段的不透明度(0-100%)
- 时段专属标签颜色:标签颜色可独立于区域颜色自定义
- 时段说明:可选信息标签,解释每个时段的特点
- 性能增强:优化代码,自动清理旧区域
主要特点:
📊 完整时段覆盖:
- 亚洲区间(纽约时间 19:00-00:00):识别盘整区和流动性池,便于后续突袭
- 伦敦杀戮区(纽约时间 02:00-05:00):标记主要波动峰值,适合止损狩猎和反转
- 纽约杀戮区(纽约时间 07:00-10:00):突出第二波主要走势,动能强劲
- 纽约午餐区(纽约时间 12:00-13:30):显示反转和盘整阶段
- 纽约下午杀戮区(纽约时间 13:30-16:00):捕捉次级走势和市场再平衡
🎨 轻松颜色自定义:
- 简单颜色名称:只需输入“蓝色”、“橙色”、“紫色”等
- 50 多种预定义颜色,包括 DodgerBlue、BlueViolet、MediumAquamarine
- 支持十六进制颜色(#RRGGBB 格式)
- 每个区域独立透明度滑块(0-100%)
- 标签颜色独立设置,确保最大清晰度
⚙️ 强大显示选项:
- 切换单个时段开关
- 显示/隐藏时段信息标签
- 可调字体大小(6-20)
- 区域可延伸至图表边缘或保持限制
- 控制显示历史天数(1-30 天)
- 自动清理防止图表杂乱
🎯 专业设计:
- 简洁、不干扰的可视化
- 活跃时段动态高低点跟踪
- 妥善处理隔夜时段
- 适用于所有时间框架
- 零延迟,性能优化
适用对象:
- 寻求精准时机的 ICT 方法交易者
- 跟踪机构资金流的聪明资金交易者
- 需要精确时段边界的日内交易者和剥头皮者
- 识别关键反转区的波段交易者
- 任何希望与主要市场时段同步交易的人
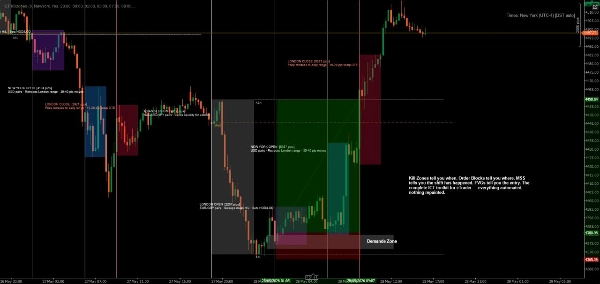
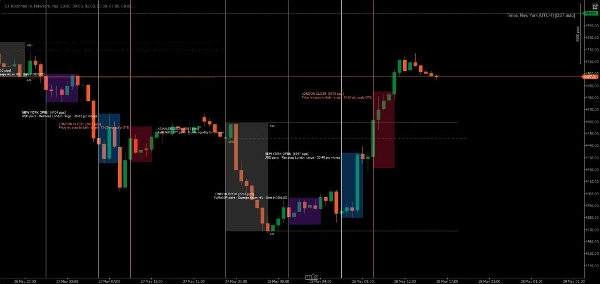
工作原理:
该指标自动检测每个交易日,并为所有五个 ICT 时段创建颜色编码区域。随着价格穿越每个时段,指标跟踪高点和低点,时段结束时绘制最终区域。标签清晰标识每个时段,并可选择显示其交易特征。
所有时间均为纽约(东部)时间,遵循标准 ICT 方法论。
自定义示例:
- 保守设置:低透明度(20-30%),颜色柔和,无时段信息
- 大胆设置:高透明度(70-80%),颜色鲜艳,完整时段描述
- 极简设置:关闭不需要的时段,仅保留偏好的杀戮区
- 颜色编码策略:将区域颜色与交易偏好匹配(绿色=多头,红色=空头)
系统要求:
- 平台:cTrader 桌面版(cTrader 商店产品不支持网页版或移动版) blog.ctrader.com
- 操作系统:Windows 7 或更高版本
- 处理器:建议双核 CPU
- 内存:最低 2 GB RAM(建议 4 GB)
- 网络连接:每秒 50 kB 或更快
安装说明:
- 购买/安装:从 cTrader 商店获取指标
- 下载 cTrader 桌面版:如果尚未安装,请从 ctrader.com 下载
- 登录:打开 cTrader 桌面版并使用您的 cTrader ID 登录
- 访问指标:导航至“Algo”部分 → “Indicators”列表
- 添加至图表:右键点击任意图表 → “Indicators” → 选择“ICT Killzones Complete”
- 自定义:右键点击图表上的指标名称 → “Settings” 调整颜色、时间和显示选项
最佳使用建议:
- 在 1 分钟至 1 小时的时间框架内使用,获得最佳可见性
- 结合价格行为和流动性概念以获得最佳效果
- 如果您的经纪商使用不同的时区,请调整时段时间
- 尝试调整透明度,找到完美的视觉平衡
- 学习时启用时段信息标签,清理图表时禁用
精准交易,自信交易,ICT 方式交易。
注意:此指标仅供教育和信息参考。过去的表现不保证未来结果。请始终进行适当的风险管理。
摘要
AI 摘要
ICT Killzones Complete is a professional indicator for the cTrader Desktop platform designed to identify and visualize five key trading sessions based on the Inner Circle Trader (ICT) methodology. It automatically detects daily trading periods in New York (Eastern) time and marks the Asian Range, London Kill Zone, New York Kill Zone, New York Lunch/Reversal Zone, and New York PM Kill Zone on the chart. Each session is color-coded with easy-to-use color names and supports over 50 predefined colors plus hex color codes. Users can independently adjust the transparency and label colors for each session, toggle sessions on or off, and display optional session information labels explaining trading characteristics.
The indicator tracks high and low prices during active sessions and finalizes zones upon session close, providing clear visual boundaries for institutional trading timing. It supports all timeframes, handles overnight sessions properly, and includes automatic cleanup of old zones to maintain chart clarity. Customization options include font size adjustment, zone extension control, and history length for displayed zones. ICT Killzones Complete is suitable for traders using ICT methodology, smart money concepts, scalping, day trading, and swing trading across markets such as Forex, commodities, and crypto. It requires cTrader Desktop on Windows 7 or higher with recommended hardware specifications.
The indicator tracks high and low prices during active sessions and finalizes zones upon session close, providing clear visual boundaries for institutional trading timing. It supports all timeframes, handles overnight sessions properly, and includes automatic cleanup of old zones to maintain chart clarity. Customization options include font size adjustment, zone extension control, and history length for displayed zones. ICT Killzones Complete is suitable for traders using ICT methodology, smart money concepts, scalping, day trading, and swing trading across markets such as Forex, commodities, and crypto. It requires cTrader Desktop on Windows 7 or higher with recommended hardware specifications.
指标配置
客户评价
4.0
评价:4
5 | 50 % | |
4 | 25 % | |
3 | 0 % | |
2 | 25 % | |
1 | 0 % |
客户评价
June 15, 2026
Hi author, thanks for sharing this indicator. However, after extensive testing, there are two major logical flaws that make it unusable for international traders in different timezones: Hardcoded Timezone (UTC/GMT Offset Bug): The indicator doesn't adapt to the user's local chart timezone settings (e.g., UTC+3 or UTC-4). It seems to force an internal UTC+0 calculation, causing the plotted session boxes to shift unexpecte
November 9, 2025
ICT Killzones nails the key trading hours - London, New York, Asia. Clean visuals, zero lag, and great for planning intraday plays. Ideal for ICT and SMC traders looking to time the market’s true volatility zones.
October 14, 2025
half size is enough at the start. It gives the trader a reason to pause.
October 13, 2025
The best part is it makes weak ideas easier to leave alone, and a small account test feels safer.
讨论
常见问答
Forex
Scalping
Commodities
SMC
Crypto
AI
XAUUSD
cTrader Store 提供的所有产品,包括交易机器人、指标和插件,均由第三方开发者提供,仅供信息参考和技术访问之用。cTrader Store 并非经纪商,不提供投资建议、个人推荐或任何未来业绩保证。


价格
注册日期 22/11/2024
133
销售
2.57K
免费安装