
AutoLines™ Support & Resistance
อินดิเคเตอร์
2 การซื้อ
เวอร์ชัน 1.0, May 2025
Windows, Mac
4.5
รีวิว: 4
คำอธิบาย
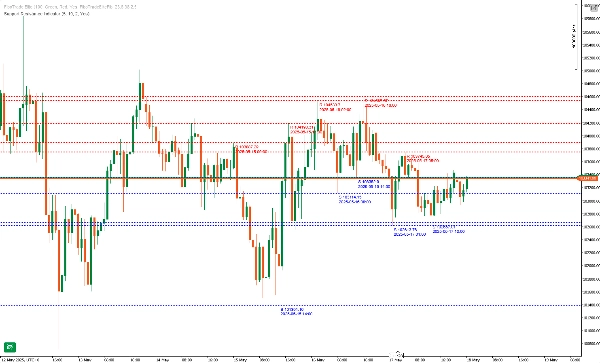
FlexSR คืออินดิเคเตอร์แนวรับและแนวต้านมืออาชีพแบบครบวงจรสำหรับ cTrader ที่จะระบุจุดสูงสุดและต่ำสุดแบบพีโวตโดยอัตโนมัติในช่วงเวลาย้อนหลังที่คุณเลือก กราฟแสดงระดับล่าสุดสูงสุดถึง N ระดับ และขยายเส้นเหล่านั้นไปทั่วแผนภูมิ ด้วยสี รูปแบบเส้น ความหนา และป้ายวันที่-ราคาที่ปรับแต่งได้อย่างเต็มที่ FlexSR ช่วยให้คุณเห็นโซนที่ชัดเจนซึ่งราคามีแนวโน้มจะหยุดชะงัก กลับตัว หรือทะลุผ่าน—เพื่อให้คุณเทรดด้วยความมั่นใจ
คุณสมบัติหลัก
สรุป
สรุปโดย AI
AutoLines™ Support & Resistance (FlexSR) is a professional indicator for cTrader that automatically detects pivot highs and lows over a user-defined lookback period. It plots up to N of the most recent support and resistance levels and extends these lines across the chart for continuous visibility. The indicator features customizable colors, line styles, thickness (1–5 px), and optional date-price labels for clear identification of key zones where price may stall, reverse, or break out.
Key functionalities include:
- Automatic pivot detection scanning each bar for true swing highs and lows.
- Dynamic management of displayed levels, showing only the user-set maximum number of lines to maintain chart clarity.
- Non-interactive, lockable lines that redraw automatically to prevent accidental changes.
- Real-time updates on every tick, ensuring levels remain current even in fast markets.
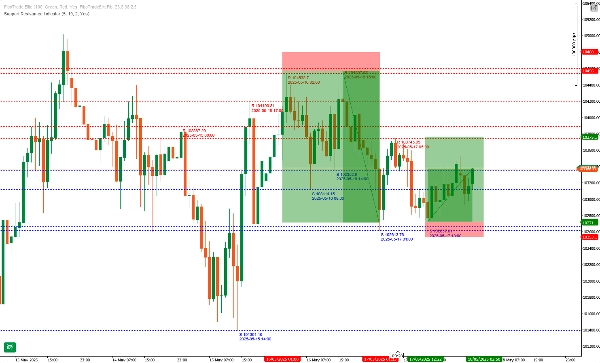
FlexSR supports intuitive trade management by visually highlighting confluence zones and providing clear support and resistance references. It is designed for ease of use with sensible default settings and minimal configuration. The indicator aids traders in identifying potential reversal and breakout points, supporting various trading strategies with precise and reliable level plotting.
Key functionalities include:
- Automatic pivot detection scanning each bar for true swing highs and lows.
- Dynamic management of displayed levels, showing only the user-set maximum number of lines to maintain chart clarity.
- Non-interactive, lockable lines that redraw automatically to prevent accidental changes.
- Real-time updates on every tick, ensuring levels remain current even in fast markets.
FlexSR supports intuitive trade management by visually highlighting confluence zones and providing clear support and resistance references. It is designed for ease of use with sensible default settings and minimal configuration. The indicator aids traders in identifying potential reversal and breakout points, supporting various trading strategies with precise and reliable level plotting.
โปรไฟล์อินดิเคเตอร์
รีวิวจากลูกค้า
4.5
รีวิว: 4
5 | 50 % | |
4 | 50 % | |
3 | 0 % | |
2 | 0 % | |
1 | 0 % |
รีวิวจากลูกค้า
November 9, 2025
AutoLines™ S&R does the heavy lifting - clear, dynamic levels that adapt to price action. Perfect for traders who love clean charts and structure. Missing alerts, but performance and accuracy make it a must-have for support/resistance setups.
May 30, 2025
May 28, 2025
May 24, 2025
messy signals are easier to question, but overconfidence is the real danger.
การสนทนา
คำถามที่พบบ่อย
Breakout
ผลิตภัณฑ์ที่มีให้บริการผ่าน cTrader Store รวมถึงบอทการเทรด อินดิเคเตอร์ และปลั๊กอิน มีให้บริการโดยนักพัฒนาบุคคลที่สามและมีไว้เพื่อวัตถุประสงค์ในการเข้าถึงข้อมูลและทางเทคนิคเท่านั้น cTrader Store ไม่ใช่โบรกเกอร์และไม่ได้ให้คำแนะนำการลงทุน คำแนะนำส่วนบุคคล หรือการรับประกันผลการดำเนินงานในอนาคต


ราคา
ตั้งแต่ 22/11/2024
133
การขาย
2.58K
ติดตั้งฟรี