
คำอธิบาย
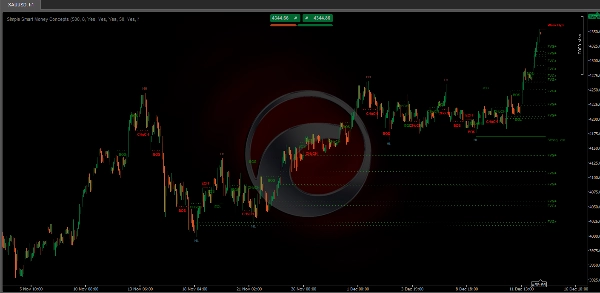
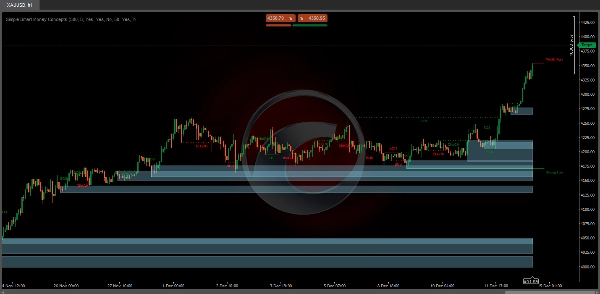
ตัวบ่งชี้ Simple Smart Money Concepts นี้แสดงโครงสร้างตลาดแบบเรียลไทม์ (internal & swing BOS / CHoCH), บล็อกคำสั่ง, โซนพรีเมียม & ส่วนลด, จุดสูง & ต่ำที่เท่ากัน และอื่นๆ อีกมากมาย... ช่วยให้เทรดเดอร์ทำเครื่องหมายบนชาร์ตของตนโดยอัตโนมัติด้วยวิธีการวิเคราะห์ราคาแบบที่ใช้กันอย่างแพร่หลาย
"Smart Money Concepts" (SMC) เป็นคำที่ใช้กันในกลุ่มเทรดเดอร์ที่ใช้การวิเคราะห์ราคาเพื่อช่วยนำทางสภาพคล่องได้อย่างแม่นยำยิ่งขึ้นและค้นหาจุดที่น่าสนใจในตลาดได้ดียิ่งขึ้น การพยายามกำหนดว่าผู้เข้าร่วมตลาดสถาบันวางคำสั่งไว้ที่ใดสามารถเป็นวิธีที่สมเหตุสมผลในการหาจุดเข้าและออกที่ใช้งานได้จริงมากขึ้นโดยอิงจากการเคลื่อนไหวของราคา
คุณสมบัติหลัก
- โครงสร้างตลาดภายในและสวิงแบบเรียลไทม์:
-
- โครงสร้างภายใน: องค์ประกอบเหล่านี้หมายถึงรูปแบบและแพทเทิร์นของราคาที่เกิดขึ้นภายในขอบเขตที่เล็กลงหรือในช่วงการเทรดเฉพาะ ชุดเครื่องมือนี้สามารถตรวจจับรายละเอียดที่ซับซ้อน เช่น ระดับแนวรับ/แนวต้านเล็กน้อยหรือการกลับตัวของแนวโน้มระยะสั้น
- โครงสร้างภายนอก: เกี่ยวข้องกับแพทเทิร์นและแนวโน้มตลาดที่ใหญ่กว่าและสำคัญกว่าซึ่งครอบคลุมหลายช่วงเวลาหรือหลายกรอบเวลา ความสามารถนี้ช่วยให้เทรดเดอร์เข้าใจทิศทางตลาดโดยรวม
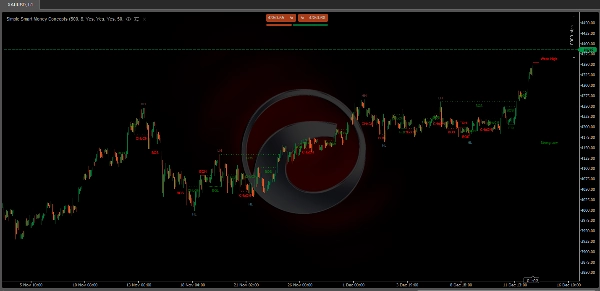
- พื้นที่ HH/LH/LL/LH:
-
- การระบุ Higher Highs (HH), Lower Highs (LH), Lower Lows (LL) และ Lower Highs (LH) ช่วยในการเข้าใจแนวโน้มและโครงสร้างตลาด ช่วยในการวิเคราะห์เชิงทำนาย
- Break of Structure (BOS):
-
- ฟีเจอร์นี้ระบุจุดที่ราคาทะลุโครงสร้างสำคัญ อาจบ่งชี้ถึงแนวโน้มหรือการกลับตัวของแนวโน้มใหม่
- Change of Character (CHoCH):
-
- ตรวจจับการเปลี่ยนแปลงพฤติกรรมตลาดอย่างละเอียด ซึ่งอาจบ่งชี้ถึงช่วงเริ่มต้นของการเปลี่ยนแปลงแนวโน้มก่อนที่จะชัดเจนต่อส่วนใหญ่ของตลาด
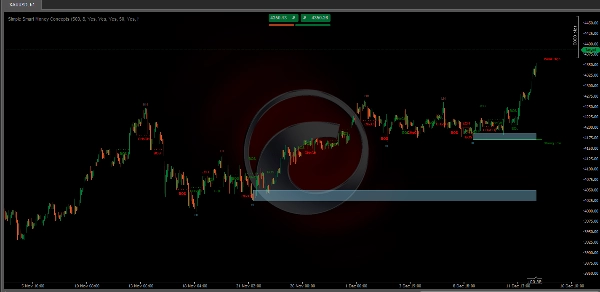
- Order Blocks:
-
- นี่คือระดับราคาหรือโซนที่มีกิจกรรมการเทรดสำคัญเกิดขึ้นก่อนหน้านี้ ซึ่งน่าจะชี้ไปยังตำแหน่งของเงินอัจฉริยะ
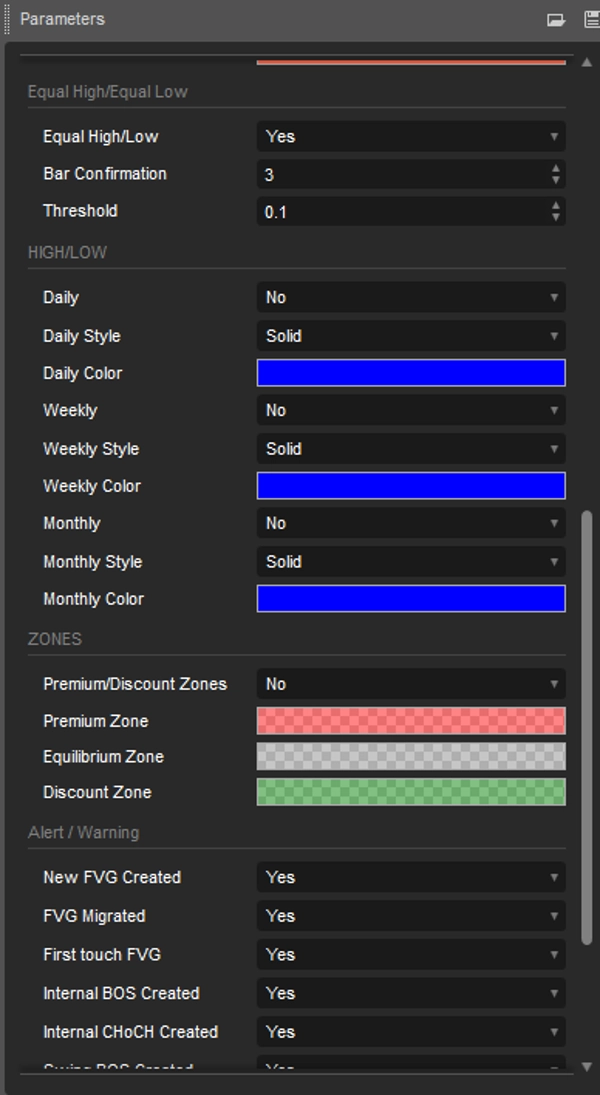
- Equal Highs and Lows
-
- แสดงป้าย EQH/EQL บนชาร์ตเพื่อการตรวจจับจุดสูง & ต่ำที่เท่ากัน
- Fair Value Gaps:
-
- Fair Value Gaps: การก่อตัวของแท่งเทียนสามแท่งที่เงาของแท่งเทียนที่อยู่ติดกับแท่งกลางไม่ทับซ้อนกัน ซึ่งเน้นพื้นที่ช่องว่าง
- Previous Highs & Lows:
-
- อนุญาตให้ผู้ใช้แสดงจุดสูง & ต่ำก่อนหน้าจากกรอบเวลารายวัน รายสัปดาห์ และรายเดือนเป็นระดับสำคัญ
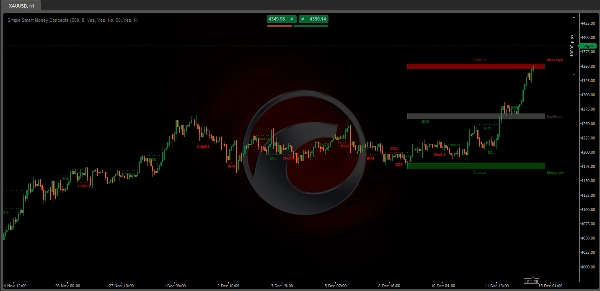
- Premium & Discount Zones as a range:
-
- อนุญาตให้ผู้ใช้แสดงโซนพรีเมียม ส่วนลด และสมดุลบนชาร์ต
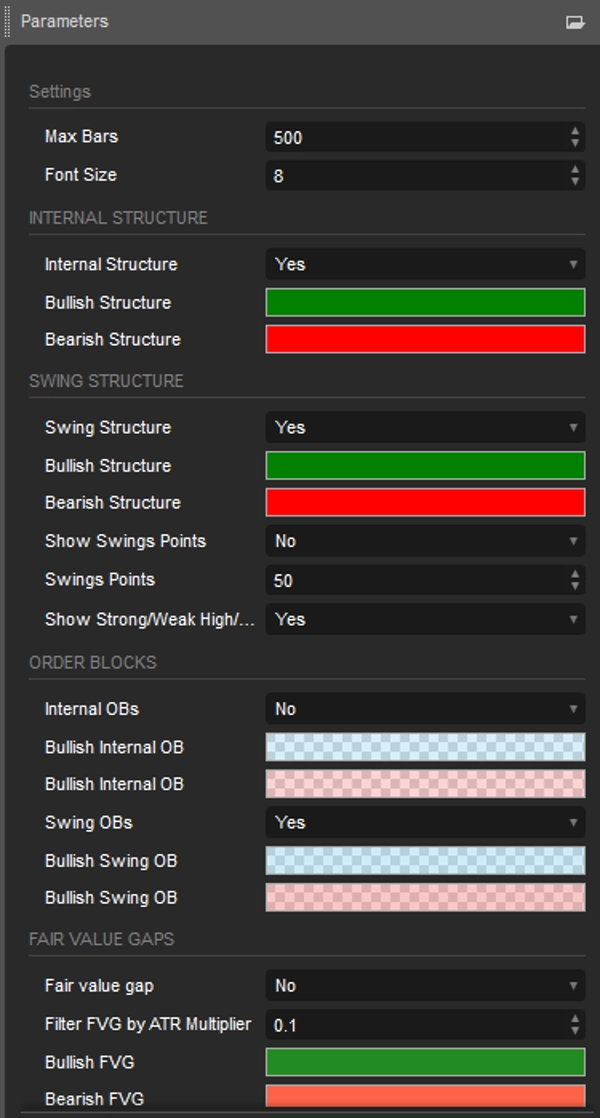
คุณสมบัติที่ปรับแต่งได้
- ผู้ใช้สามารถปรับการตั้งค่า เช่น ความยาวข้อมูล สี และรูปแบบการแสดงผลให้ตรงกับความชอบในการเทรดของตน
ประโยชน์สำหรับเทรดเดอร์
- ประหยัดเวลาการวิเคราะห์ด้วยตนเอง เพิ่มประสิทธิภาพในการเทรด
- ช่วยให้ตัดสินใจได้รวดเร็วและมีข้อมูลในช่วงตลาดที่ผันผวน
- ใช้งานง่ายสำหรับทั้งผู้เริ่มต้นและเทรดเดอร์ที่มีประสบการณ์
บทสรุป
ตัวบ่งชี้ Simple Smart Money Concepts Indicator ไม่ใช่แค่เครื่องมือ แต่เป็นโซลูชันครบวงจรสำหรับเทรดเดอร์ที่ต้องการนำกลยุทธ์ ICT ไปใช้ได้อย่างมีประสิทธิภาพ เป็นตัวเลือกที่แข็งแกร่งสำหรับการเพิ่มประสิทธิภาพการวิเคราะห์ตลาดและการดำเนินการเทรดที่แม่นยำ
สรุป
Additional features include the identification of equal highs and lows, fair value gaps (three-candle formations indicating price gaps), and previous highs and lows across daily, weekly, and monthly timeframes. It also displays premium, discount, and equilibrium zones to help traders assess value areas.
Users can customize settings such as data length, colors, and display styles to fit their trading preferences. The indicator supports analysis across multiple markets including Forex, cryptocurrencies (e.g., BTCUSD), stocks, and commodities (e.g., XAUUSD).
Designed to streamline chart analysis, the Simple Smart Money Concepts indicator aids traders in making informed decisions by visually representing widely used price action methodologies and institutional order flow concepts.
รีวิวจากลูกค้า
5 | 33 % | |
4 | 67 % | |
3 | 0 % | |
2 | 0 % | |
1 | 0 % |


