
Frac Support Resistance V1
อินดิเคเตอร์
2 การซื้อ
เวอร์ชัน 1.0, Nov 2025
Windows, Mac
5.0
รีวิว: 1
คำอธิบาย
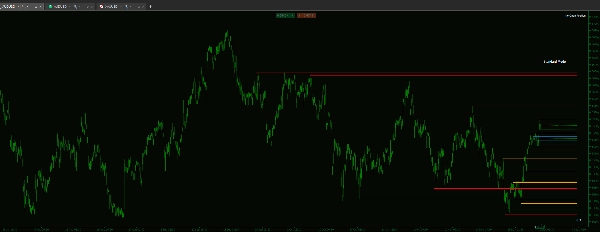
หากคุณเทรดโดยอิงตาม โครงสร้างตลาด คุณจะรู้ว่าระดับที่สำคัญที่สุดมักถูกตั้งไว้บน กรอบเวลาที่สูงกว่า ตัวชี้วัดที่กำหนดเองนี้ช่วยแก้ปัญหาความยุ่งยากในการระบุและติดตามระดับเหล่านั้นด้วยตนเอง
เครื่องมือนี้ถูกออกแบบมาเพื่อให้มีลำดับชั้นภาพที่เชื่อถือได้ เพื่อให้คุณสามารถเห็นขอบเขตโครงสร้างที่สำคัญและจัดลำดับความสำคัญของโซนที่มีมูลค่าสูงโดยไม่ต้องออกจากหน้าจอการดำเนินการของคุณ
คุณสมบัติหลัก & การควบคุมอย่างละเอียด
- ตัวชี้วัดถูกสร้างขึ้นเพื่อประสิทธิภาพที่ยอดเยี่ยมและการแสดงผลกราฟที่สะอาดตา:
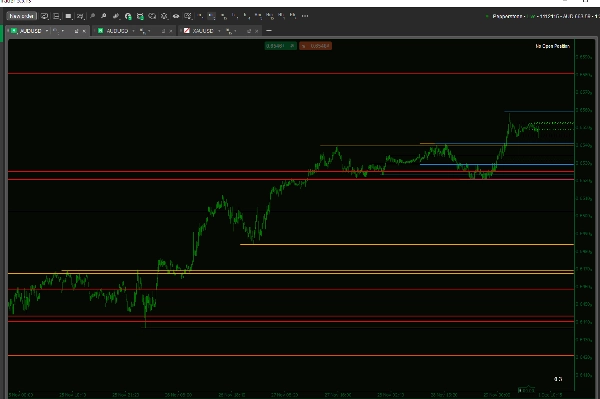
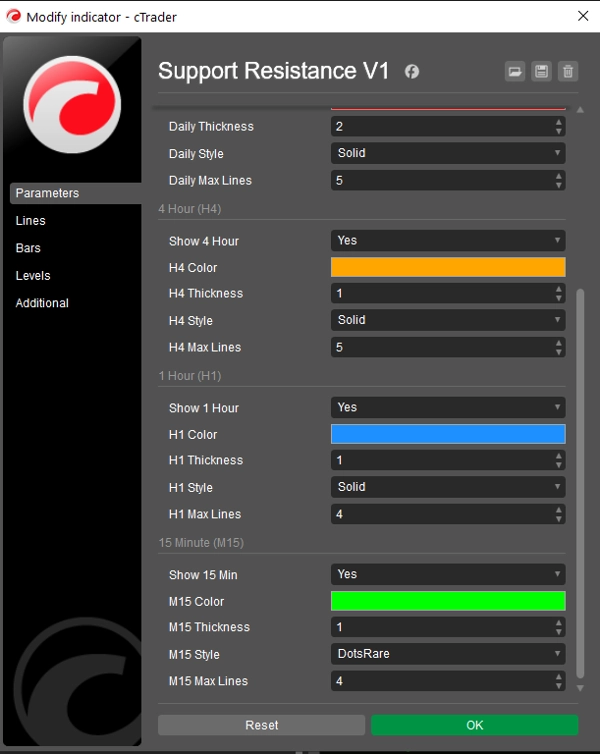
- ลำดับชั้นภาพที่แท้จริง: ควบคุมความหนา รูปแบบเส้น (ทึบ ขีด จุด) และสีได้อย่างอิสระสำหรับทุกกรอบเวลา
- ประโยชน์: รับรู้ความแข็งแกร่งของระดับได้ทันทีเพียงแค่ดูจากรูปลักษณ์ (เช่น ตั้งเส้น D1 ให้หนา/ทึบสำหรับโครงสร้างหลัก และเส้น H1 ให้บาง/ประสำหรับระดับทันที)
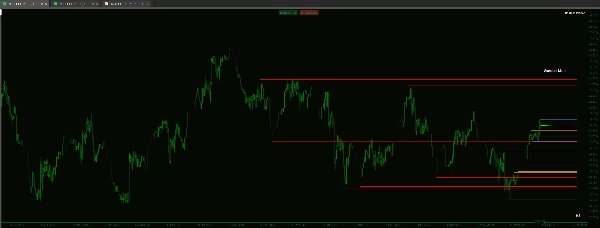
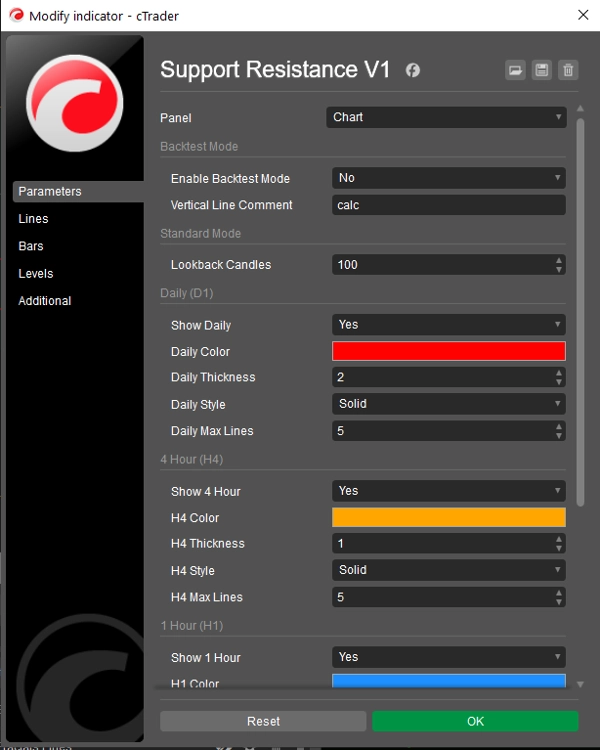
- การควบคุมประสิทธิภาพ & โฟกัส: เบื่อกราฟที่รกหรือไม่? คุณสามารถจำกัดจำนวนเส้นสูงสุดที่แสดงสำหรับแต่ละกรอบเวลาได้อย่างอิสระ
- ตัวอย่าง: ตั้งค่าเส้นสูงสุด H4 เป็น 5 และเส้นสูงสุด D1 เป็น 15 เพื่อจัดลำดับความสำคัญของระดับล่าสุดในกรอบเวลาที่ต่ำกว่าในขณะที่ยังคงมุมมองลึกของโครงสร้างหลัก
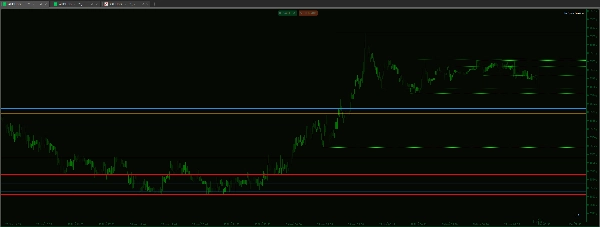
- พื้นฐานโค้ดที่สะอาด: สร้างขึ้นบนตรรกะแฟรคทัลที่เชื่อถือได้ เพื่อให้แน่ใจว่าระดับที่ระบุเป็นจุดสูง/ต่ำจริงที่ใช้ในการวิเคราะห์โครงสร้างมาตรฐาน
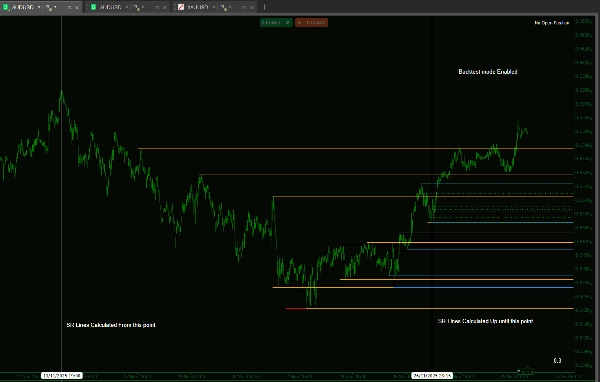
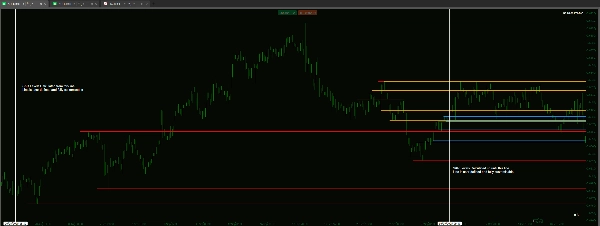
- โหมดทดสอบย้อนหลังเฉพาะ: รวมฟังก์ชันจำกัดการวิเคราะห์ของตัวชี้วัดในช่วงเวลาที่กำหนดบนกราฟ ซึ่งจำเป็นสำหรับการทดสอบย้อนหลังด้วยตนเองที่แม่นยำโดยการจำลองการเคลื่อนที่ของเวลาโดยไม่มีอคติจากอนาคต
สรุป
สรุปโดย AI
Frac Support Resistance V1 is a technical indicator designed to automatically calculate and display smart support and resistance lines derived from multiple timeframes: daily (D1), 4-hour (H4), hourly (H1), and 15-minute (M15). It assists traders who rely on market structure by visually highlighting critical price levels established on higher timeframes, reducing the need for manual identification.
Key features include customizable visual hierarchy, allowing independent adjustment of line thickness, style (solid, dashed, dotted), and color for each timeframe. This enables quick recognition of the relative strength of support and resistance levels. Users can also control chart clarity by setting maximum numbers of lines per timeframe to prioritize recent or major structural levels.
The indicator is based on fractal logic to identify genuine high and low pivots consistent with standard market structure analysis. It includes a dedicated backtesting mode that restricts analysis to a specified historical period, facilitating unbiased manual strategy testing by simulating real-time progression.
Frac Support Resistance V1 supports various markets including Forex, cryptocurrencies, commodities, indices, and stocks, with tags indicating compatibility with symbols like BTCUSD, EURUSD, GBPUSD, XAUUSD, NAS100, and USDJPY. The tool is suited for strategies involving breakout, scalping, smart money concepts, and grid trading.
โปรไฟล์อินดิเคเตอร์
รีวิวจากลูกค้า
5.0
รีวิว: 1
5 | 100 % | |
4 | 0 % | |
3 | 0 % | |
2 | 0 % | |
1 | 0 % |
รีวิวจากลูกค้า
December 1, 2025
A small account test feels safer, and the plan becomes easier to stick with, and the chart still needs a final look.
การสนทนา
คำถามที่พบบ่อย
BTCUSD
Forex
Signal
Breakout
Indices
EURUSD
Commodities
GBPUSD
NZDUSD
Prop
Scalping
SMC
Crypto
Grid
Stocks
AI
XAUUSD
NAS100
USDJPY
ผลิตภัณฑ์ที่มีให้บริการผ่าน cTrader Store รวมถึงบอทการเทรด อินดิเคเตอร์ และปลั๊กอิน มีให้บริการโดยนักพัฒนาบุคคลที่สามและมีไว้เพื่อวัตถุประสงค์ในการเข้าถึงข้อมูลและทางเทคนิคเท่านั้น cTrader Store ไม่ใช่โบรกเกอร์และไม่ได้ให้คำแนะนำการลงทุน คำแนะนำส่วนบุคคล หรือการรับประกันผลการดำเนินงานในอนาคต


!["[Hamster-Coder] Pivot Points MTF" โลโก้](https://cdn.ctrader.com/image/webp/4c143e5a-309c-40e3-a578-f04d1e133ffa_31159)
ราคา
ตั้งแต่ 14/01/2025
55
การขาย
11.5K
ติดตั้งฟรี