
Opis
wskaźnik który koloruje świece w czasie rzeczywistym na podstawie struktury rynku oraz rysuje strefy płynności, przepływy instytucjonalne i zakresy konsolidacji. Zaprojektowany dla traderów działających zgodnie z Smart Money Concepts (SMC) zasadami.
🧠 Logika algorytmu
https://chartshots.spotware.com/c/69f0e3fd81319
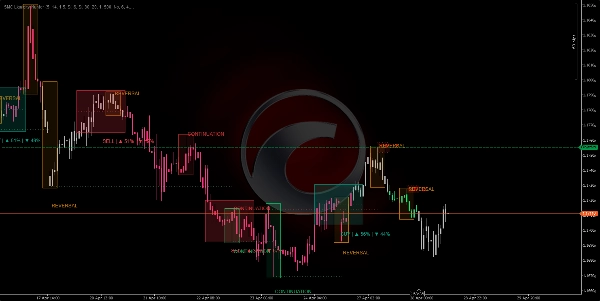
1. Wykrywanie struktury rynku 🔍
- Znajduje punkty zwrotne (lokalne maksima i minima) używając konfigurowalnego okresu retrospekcji.
- Porównuje kolejne punkty zwrotne aby określić strukturę:
-
- Wyższe maksima + wyższe minima = Byczy trend 📈
- Niższe maksima + niższe minima = Niedźwiedzi trend 📉
- Mieszane sygnały = Neutralny trend ➡️
- Filtruje szumy: liczy tylko punkty zwrotne, które przekraczają próg oparty na ATR (Average True Range) pomnożonym przez regulowaną czułość.
https://chartshots.spotware.com/c/69f0e7e752b74
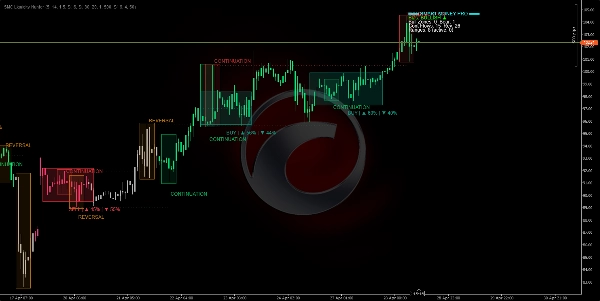
2. Przepływy instytucjonalne (Flow Boxes) 🔄
- Za każdym razem, gdy powstaje nowy znaczący punkt zwrotny, algorytm rysuje linię poziomą od poprzedniego punktu do nowego.
- Klasyfikuje przepływ jako:
-
- Kontynuacja: cena respektuje trend (HL w trendzie wzrostowym, LH w trendzie spadkowym) ✅
- Odwrócenie: cena łamie strukturę (LL w trendzie wzrostowym, HH w trendzie spadkowym) ⚠️
- Rysuje kolorowe pole wokół punktu zwrotnego oznaczonego "CONTINUATION" lub "REVERSAL".
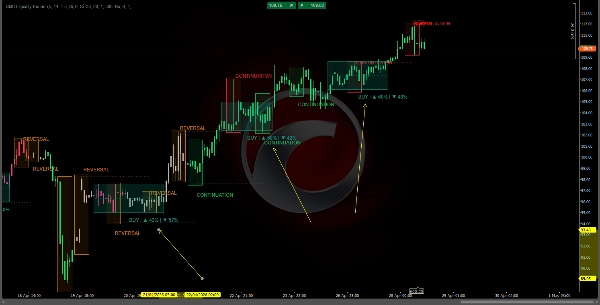
3. Strefy podaży/popytu (płynność) 💧
https://chartshots.spotware.com/c/69f0e8e7aef29
- Wokół każdego znaczącego punktu zwrotnego rysowana jest pozioma wstęga rozciągająca się w przyszłość na konfigurowalną liczbę świec.
- Te strefy reprezentują niezrealizowane zlecenia instytucjonalne:
-
- Punkty zwrotne niedźwiedzie → strefa PODAŻY (zlecenia sprzedaży) 🔴
- Punkty zwrotne bycze → strefa POPYTU (zlecenia kupna) 🟢
- Strefa zanika i znika kiedy cena przebija ją z odpowiednią siłą lub gdy upływa jej czas życia.
4. Silnik wykrywania zakresów (konsolidacje) 📦
- Oblicza prosty średni ruchomy (SMA) z pasmem ATR wokół niego.
- Jeśli każda pojedyncza świeca w oknie retrospekcji pozostaje w obrębie pasma, algorytm identyfikuje zakres konsolidacji.
- Rysuje niebieski prostokąt z:
-
- Przerywaną linią środkową (równowaga zakresu) ⚖️
- Procentowym prawdopodobieństwem wybicia byczym/niedźwiedzim na podstawie:
-
- Momentum kierunkowe (ADX/DI+ vs DI-) 📐
- Skumulowana objętość bycza vs niedźwiedzia w zakresie 📊
- Czas spędzony w górnej vs dolnej połowie ⏱️
5. Kolorowanie świec (czyste i wizualne) 🕯️
- Zielona świeca = potwierdzona bycza struktura (HH+HL) 🟢
- Magenta/czerwona świeca = potwierdzona niedźwiedzia struktura (LH+LL) 🔴
- Szara świeca = neutralna lub przejściowa faza ⚪
- Brak nakładających się prostokątów: prawdziwe knoty i korpusy są zawsze w pełni widoczne.
📋 Panel kontrolny (róg)
Numeryczne podsumowanie aktywnych stref, przepływów i zakresów
🛠️ Jak go używać
⚙️ Zalecane ustawienia
- Interwał czasowy: H1 lub wyższy (idealny dla Smart Money).
- Domyślne parametry: dobrze działają dla Forex, indeksów i kryptowalut.
- Dostosuj czułość: zwiększ dla rynków zmiennych, zmniejsz dla rynków bocznych o nieregularnym ruchu.
📗 Zasady handlu :
✅ Wejście długie (KUPNO)
- Świece muszą być zielone (aktywny byczy trend) 🟢
- Cena dotyka lub zbliża się do aktywnej strefy "DEMAND" 🟢
- Pojawia się pole "CONTINUATION" (nie "REVERSAL") w tej strefie ✅
- Panel kontrolny pokazuje prawdopodobieństwo byczego wybicia > 60% na aktywnym zakresie (jeśli istnieje) 📊
✅ Wejście krótkie (SPRZEDAŻ)
- Świece muszą być magenta/czerwone (aktywny niedźwiedzi trend) 🔴
- Cena dotyka lub zbliża się do aktywnej strefy "SUPPLY" 🔴
- Pojawia się pole "CONTINUATION" (nie "REVERSAL") w tej strefie ✅
- Panel kontrolny pokazuje prawdopodobieństwo niedźwiedziego wybicia > 60% 📊
❌ Nie handluj jeśli...
- Świece są szare (brak określonego trendu) ⚪
- Pojawia się sygnał "REVERSAL" dokładnie tam, gdzie miałeś wejść ⚠️
- Cena jest w niebieskim zakresie bez wyraźnego wybicia 🔵
- Panel kontrolny pokazuje przeciwne zbieżności (niedźwiedzia zbieżność na byczej konfiguracji lub odwrotnie) 🔄
📈 Interpretacja panelu kontrolnego
tekst
═══ SMART MONEY PRO ═══
Trend: BYCZY ▲ ← Aktualny trend rynkowy
Strefy bycze: 2 Niedźwiedzie: 1 ← Aktywne strefy płynności
Kontynuacje przepływów: 3 Odwrócenia: 0 ← Kontynuacje vs odwrócenia
Zakresy: 4 (aktywne: 1) ← Łączne i aktywne zakresy
Aktywny zakres ▲65% ▼35% ← Prawdopodobieństwo wybicia
⚡ BYCZA ZBIEŻNOŚĆ ← Maksymalny sygnał zgodności
💡 Kluczowe zasady
- ✅ Brak przemalowywania: wszystko jest obliczane wyłącznie na podstawie danych zamkniętych świec.
- ✅ Czysty wykres: kolorowe prawdziwe świece, półprzezroczyste strefy, brak wizualnego bałaganu.
- ✅ Podgląd struktury: kolor świecy informuje o fazie rynku zanim punkty zwrotne staną się oczywiste.
- ✅ Wbudowana zbieżność: gdy aktywna strefa + aktywny zakres + sygnał przepływu są zgodne, panel kontrolny wyraźnie to sygnalizuje.
Podsumowanie
Key features include:
- **Institutional Flows:** Draws horizontal lines and colored boxes between significant pivots, labeling flows as "CONTINUATION" or "REVERSAL" to indicate trend respect or break.
- **Supply and Demand Zones:** Highlights unexecuted institutional orders with horizontal bands around pivots, distinguishing supply (sell) and demand (buy) zones that expire or break upon price penetration.
- **Range Detection:** Identifies consolidation ranges using an SMA with ATR bands, marking them with blue rectangles and providing breakout probability percentages based on momentum, volume, and time distribution.
- **Dashboard:** Displays numeric summaries of active zones, flows, ranges, and breakout probabilities, including confluence signals when multiple factors align.
Recommended for use on H1 or higher timeframes, the indicator suits Forex, indices, and cryptocurrencies. It operates without repainting by relying on closed bar data and maintains a clean chart presentation with visible candle wicks and bodies.
Opinie klientów
5 | 50 % | |
4 | 0 % | |
3 | 0 % | |
2 | 50 % | |
1 | 0 % |


