
Descripción
- Transforma tus gráficos en una sinfonía visual de claridad de tendencias.
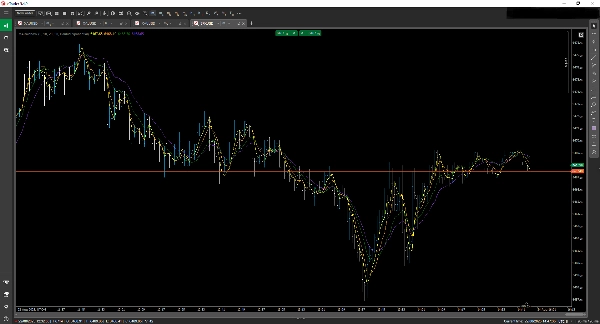
El Indicador MARainbow es una herramienta elegante y multicapa de medias móviles diseñada para traders que exigen precisión, flexibilidad y claridad estética. Ya sea que estés haciendo scalping en movimientos intradía o analizando tendencias a largo plazo, MARainbow te da la ventaja con cuatro medias móviles personalizables, cada una codificada por colores para un reconocimiento instantáneo.
🔧 Características clave
• Cuatro medias móviles distintas
Muestra hasta 4 medias móviles simultáneamente, cada una con su propio color y configuración de período para una rápida diferenciación visual.
• Múltiples tipos de MM
Elige entre:
• Media Móvil Simple (SMA)
• Media Móvil Exponencial (EMA)
• Media Móvil Exponencial Doble (DEMA)
• Y otros.
Combina y ajusta para adaptar a tu estrategia.
• Entradas personalizables
• Selecciona períodos individuales para cada MM
• Asigna colores únicos para mejor legibilidad del gráfico
• Activa o desactiva la visibilidad de cada línea de forma independiente
• Claridad de tendencia de un vistazo
El efecto arcoíris te ayuda a identificar instantáneamente la dirección, fuerza y posibles reversiones de la tendencia—sin más dudas.
• Optimizado para cTrader
Se integra perfectamente con la plataforma cTrader, ofreciendo un rendimiento fluido y configuraciones intuitivas.
Resumen
Valoraciones de clientes
5 | 0 % | |
4 | 100 % | |
3 | 0 % | |
2 | 0 % | |
1 | 0 % |


![Logotipo de "[Hamster-Coder] Moving Average MTF"](https://cdn.ctrader.com/image/webp/b11b98b1-194d-4b8e-b00e-d611826ad159_31226)


