
Descripción
Algoritmo Inteligente de Seguimiento
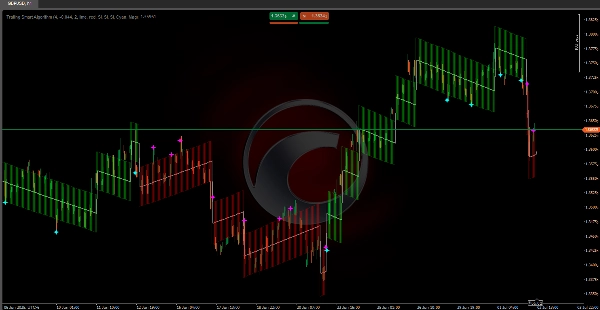
https://chartshots.spotware.com/c/69f0f1d89000b
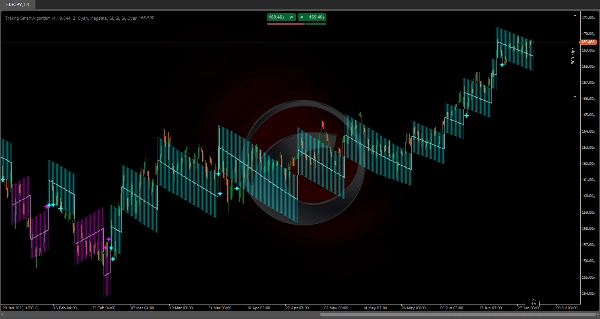
Incorpora algoritmos matemáticos 🧠 diseñados específicamente para seguir consistentemente el precio en cualquier condición de mercado 🌐.
Su estructura de cálculo asegura que la línea de tendencia siempre se mantenga sincronizada con los movimientos del precio, evitando el retraso típico de los indicadores tradicionales ⏳.
A diferencia de los algoritmos convencionales, este sistema utiliza mediciones precisas de volatilidad 📊 y aplica ajustes automáticos ⚙️ que garantizan un seguimiento óptimo. Sus cálculos internos están diseñados para ofrecer una representación precisa de la dirección del mercado, manteniendo la precisión tanto durante movimientos rápidos ⚡ como en el desarrollo gradual de la tendencia 🕊️.
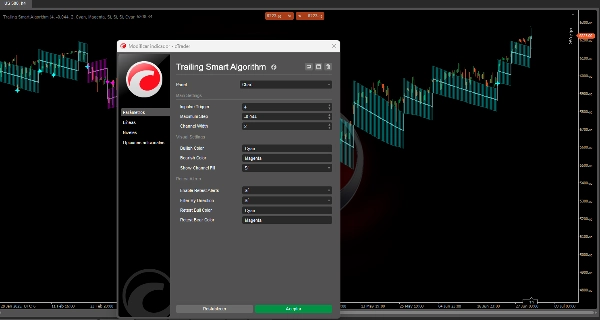
https://chartshots.spotware.com/c/69f0f218591b0
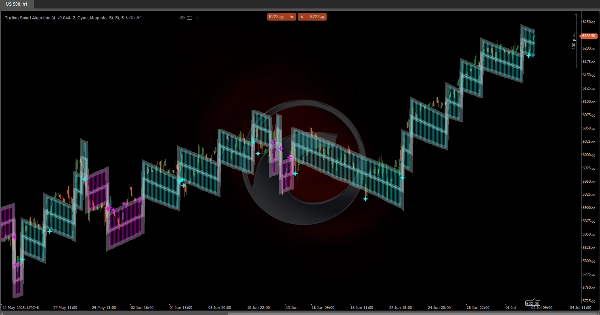
💡 ¿Cómo Funciona?
El indicador opera usando un sistema de pasos adaptativos que se mueve en la dirección de la tendencia dominante.
Se basa en tres componentes principales:
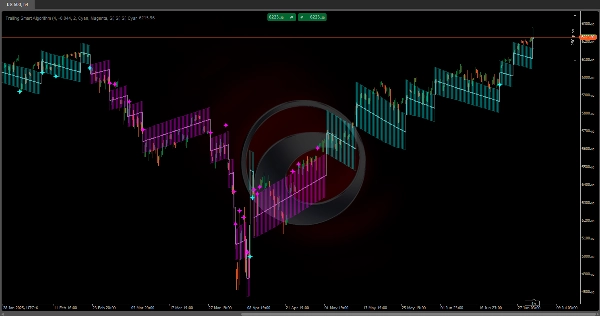
https://chartshots.spotware.com/c/69f0f2b19e4d3
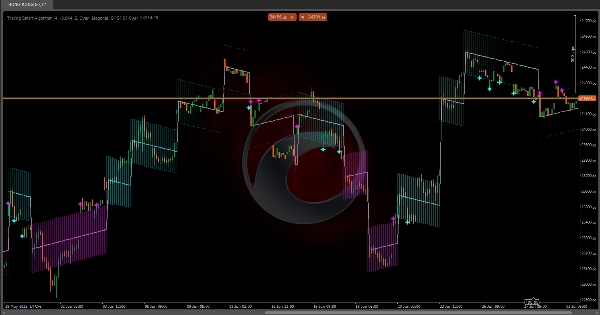
1️⃣ Detección de Cambio de Tendencia
El sistema monitorea continuamente el precio para detectar movimientos significativos que superen un umbral específico (Disparador de Impulso 🎯).
Cuando el precio se aleja lo suficiente de la línea de tendencia actual, el indicador reconoce un posible cambio de dirección y reposiciona su línea principal.
2️⃣ Seguimiento Dinámico
Una vez establecida la dirección, la línea de tendencia se mueve paso a paso 🪜 en la misma dirección que el mercado.
Cada paso se calcula en función de la volatilidad actual (ATR 📈):
• En mercados más volátiles, los pasos son más grandes 🌊
• En mercados más tranquilos, los pasos son más pequeños 🌿
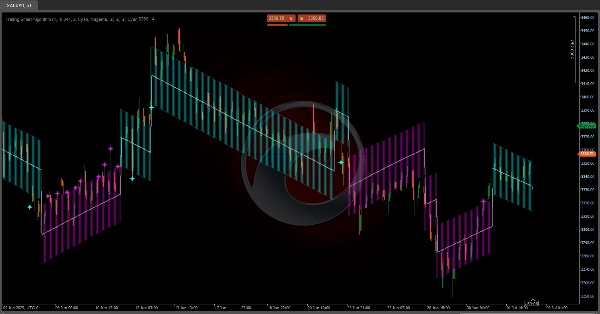
3️⃣ Canal de Volatilidad
Se forma un canal alrededor de la línea principal (bandas superior e inferior) que representa la zona normal de volatilidad 📉📈.
Este canal ayuda a identificar si el precio se comporta dentro de parámetros normales o está realizando movimientos extremos 🚨.
📏 Canal de Volatilidad
• Banda Superior: Límite superior del canal de volatilidad
• Banda Inferior: Límite inferior del canal de volatilidad
✨ Señales de Retesteo
• Estrellas Cian 🌟: El precio toca o cruza la banda inferior durante una tendencia alcista
• Estrellas Magenta ⭐: El precio toca o cruza la banda superior durante una tendencia bajista
⚙️ Configuración de Parámetros
🔹 Parámetros Principales
Disparador de Impulso (valor predeterminado: 4)
¿Qué hace?
Determina la sensibilidad para detectar cambios de tendencia. Es el multiplicador ATR que define cuánto debe moverse el precio para activar un cambio de dirección.
Impacto al modificarlo:
• Valores más altos (5–8):
- Más resistencia a cambios de tendencia 🛡️
- Menos señales falsas
- Respuesta más lenta a cambios reales
• Valores más bajos (2–3):
- Mayor sensibilidad 🎯
- Reacción más rápida
- Más propenso a producir señales falsas en mercados laterales
Paso Máximo (valor predeterminado: -0.044)
¿Qué hace?
Limita el tamaño máximo de cada paso que la línea de tendencia puede tomar. Es un valor negativo que actúa como un límite.
Impacto al modificarlo:
• Menos negativo (-0.020 a -0.030):
- Pasos más grandes 🚀
- Seguimiento de tendencia más agresivo
• Más negativo (-0.050 a -0.080):
- Pasos más pequeños y graduales 🌱
- Seguimiento más conservador
Ancho del Canal (valor predeterminado: 2)
¿Qué hace?
Define el ancho del canal de volatilidad alrededor de la línea principal.
Impacto al modificarlo:
• Valores más altos (3–4):
- Canal más ancho 🟢
- Menos señales de retesteo
- Mayor tolerancia a la volatilidad
• Valores más bajos (1–1.5):
- Canal más estrecho 🔴
- Más señales de retesteo
- Más sensibilidad al ruido
🎨 Parámetros Visuales
Color Alcista / Color Bajista
Define los colores para tendencias alcistas y bajistas respectivamente.
Mostrar Relleno del Canal
Habilita o deshabilita el relleno visual del canal de volatilidad 🌈.
🔔 Configuración de Retesteo
Habilitar Alertas de Retesteo
Activa o desactiva las señales de retesteo cuando el precio toca las bandas del canal.
Filtrar Por Dirección
Cuando está habilitado, solo muestra señales de retesteo que coinciden con la tendencia actual:
• En una tendencia alcista: Solo señales en la banda inferior
• En una tendencia bajista: Solo señales en la banda superior
🌟 Resumen de Señales de Retesteo
• Estrella Cian en Banda Inferior: Potencial rebote alcista desde soporte dinámico ✅
• Estrella Magenta en Banda Superior: Potencial rebote bajista desde resistencia dinámica ❌
Resumen
Valoraciones de clientes
5 | 100 % | |
4 | 0 % | |
3 | 0 % | |
2 | 0 % | |
1 | 0 % |


![Logotipo de "[Stellar Strategies] MARSI Signal Plotter"](https://cdn.ctrader.com/image/webp/7b2b8da6-8f8e-4646-8d4a-4710c516c01e_25567)

