
Descripción
🚀 Más de 10,000 traders ya usan nuestros PRINCIPALES indicadores🏆
Descubre por qué los profesionales nos eligen: las herramientas más poderosas en cTrader (indicadores, algoritmos y cBots) te están esperando.
👉 Obtén todos nuestros sistemas TOP aquí:
_______________________________________________
📌 Indicadores de Estructura de Mercado
· ✅ AdvancedMarket Structure: Bos, Choch, SwinLevels, Order Blocks, Market Structure& Liquidity Finder
· 🔄 Análisis Dinámico de Estructura de Mercado de Puntos de Giro
· 🧱 Bloque de Orden
· ⛓️ BOS & CHOCH
· 🧠 ICT Poder de 3
· 🌀 Zonas de Polaridad de Mercado
_______________________________________________
🔚 Sistemas Inteligentes de Salida
· 📍 Algoritmo Inteligente de Seguimiento
_______________________________________________
📐 Indicadores ZigZag
· 🔍 Proyección de Liquidez de Precio ZigZag
· ➖ ZigZag
· 🎯 Rastreador de Extremos Zig-Zag
_______________________________________________
🧱 Indicadores de Soporte y Resistencia
· 🟩 Líneas de Soporte y Resistencia SmartTrend
· 🧱 Todos los Niveles de Soporte y Resistencia
_______________________________________________
📊 Indicadores de Tendencia y Canal
· 🔄 Canal de Tendencia Automático
· 📊 Supertrend
· ⚡Analizador de Tendencia Momentum
· 🧠 Canal de Tendencia Adaptativo
· 💥 Sistema de Ruptura de Canal
· 🌈 Gradiente Dinámico de Tendencia
_______________________________________________
💧 Herramientas de Volumen y Liquidez
· 🔥 Mapa de Calor POC de Volumen
· 📉 Mapa de Liquidación por Apalancamiento
· 🔍 Brecha de Valor Justo Momentum
· 🕒 Sesiones de Brecha de Valor Justo
_______________________________________________
⚡ Indicadores de Momentum y RSI
· 📈 Disparador de Tendencia RSI
· 🚀 Momentum de Rango Dinámico
· 🔎 Sesgo de Vela Multi-Nivel
Rastreador
_______________________________________________
🔮 Herramientas de Predicción y Proyección
· 📐 Predicción Basada en Linreg& ATR
· 📏 Regresión Lineal Fibonacci Multi-temporal
· 📈 Proyector de Flujo de Mercado Potenciado por Volumen
🟢 Identificando Bloques de Orden 🔴
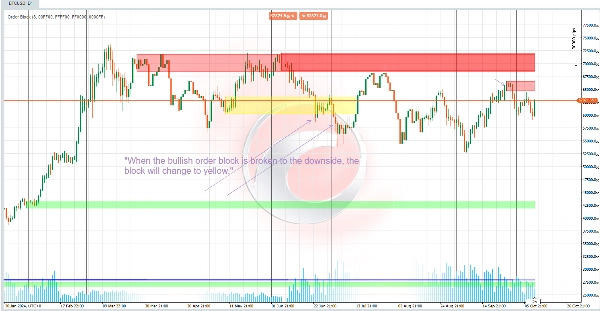
**Bloque de Orden Alcista 🚀:**
Para detectar un bloque de orden alcista:
- El código verifica si el precio de cierre actual supera el punto más alto de un giro previo ⬆️.
- Si es así y ese giro aún no ha sido cruzado, se marca como cruzado. El bloque de orden se define entonces desde el precio más bajo hasta el más alto en las velas previas 📈.
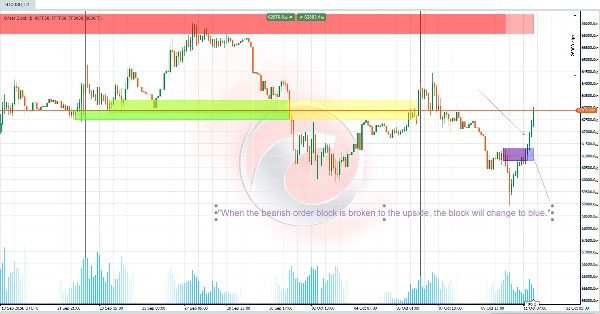
**Bloque de Orden Bajista 🔻:**
- Funciona de manera similar pero se aplica a giros de precio bajos.
- Se crea un bloque de orden bajista cuando el precio de cierre actual cae por debajo del punto más bajo de un giro ⬇️.
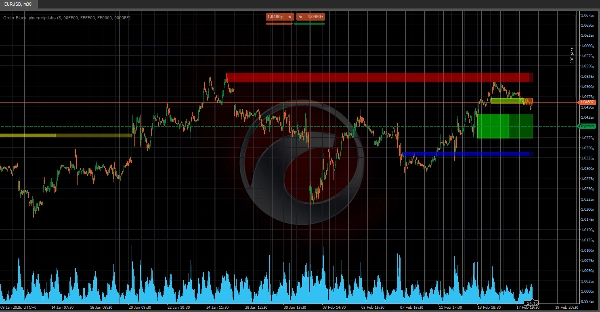
### 💼 Funcionalidad del Bloque de Orden 📊
Los Bloques de Orden representan **zonas de acumulación de alto volumen** donde grandes jugadores del mercado pueden haber operado significativamente
Estas áreas a menudo actúan como posibles niveles de soporte o resistencia y pueden señalar la continuación o reversión de una tendencia 📉📈.
- **Soporte o Resistencia:** Los bloques de orden rotos pueden indicar áreas relevantes de soporte o resistencia, dependiendo de la tendencia previa 🔄.
- **Continuación o Reversión:**
- Una ruptura de un bloque de orden en dirección opuesta puede indicar una posible reversión 🔄.
- Romper en la misma dirección puede confirmar la continuación de una tendencia 🔗.
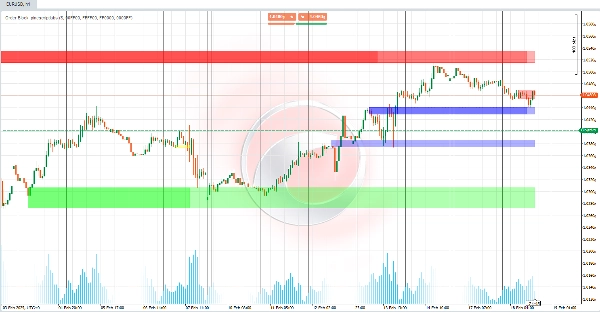
Este indicador es poderoso para identificar **niveles clave en los gráficos** 📈, ayudando a los traders a visualizar áreas importantes basadas en el comportamiento del precio en zonas de alto volumen. ¡Perfecto para detectar tendencias y movimientos del mercado! 🎯📊
Resumen
Valoraciones de clientes
5 | 100 % | |
4 | 0 % | |
3 | 0 % | |
2 | 0 % | |
1 | 0 % |


