
Descripción
Indicadores de Pinescriptlabs Store: Pinescriptlabs Store cBots : (cBot) Gold & BTC BreakoutSession Pivots(nuevo)
Mapa de Liquidación de Apalancamiento
Predicción Basada en Linreg & ATR
SmartTrend Soporte &
Resistencia
Líneas
Sesiones de Brecha de Valor Justo
Análisis
Dinámico
de la Estructura
del Mercado
de
Puntos de Giro
Regresión
Lineal
Fibonacci
Multitemporal
Brecha de Valor Justo de Momentum
Proyección del Flujo del Mercado
Gradiente de Tendencia Dinámico
Rastreador
de Sesgo
de Velas
Multinivel
Rastreador de Extremos Zig-Zag
Soporte
y Resistencia
Automáticos
de Tendencia
Líneas
Todos
los Soportes
y Resistencias
Niveles
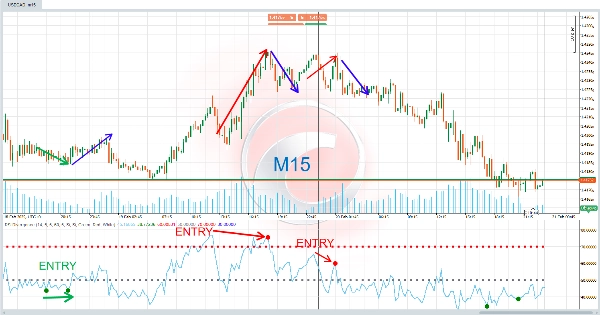
El RSI Divergencia es una herramienta avanzada de análisis técnico diseñada para detectar divergencias entre el precio y el Índice de Fuerza Relativa (RSI) . Estas divergencias son señales poderosas que pueden anticipar cambios en la dirección del mercado, convirtiéndola en un recurso invaluable para los traders técnicos. 🔍💡
⚙️ ¿Cómo Funciona?
Este indicador opera bajo el principio de que el precio y el RSI no siempre se mueven sincronizados. Cuando ocurre una divergencia, significa que el precio está enviando una señal contraria a la tendencia subyacente del RSI. Esto puede ser una advertencia temprana de que la tendencia actual podría estar perdiendo fuerza.
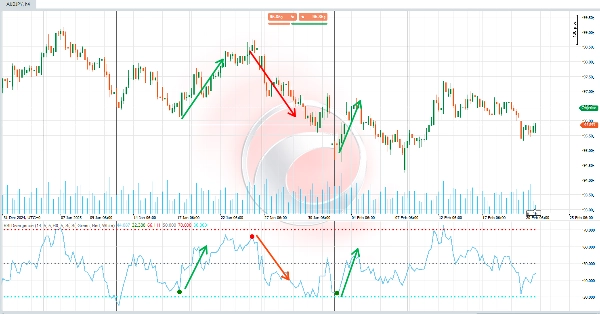
- Divergencia Alcista (Tendencia Alcista) 📈 :
Ocurre cuando el precio forma mínimos más bajos , pero el RSI forma mínimos más altos . Esto sugiere que, aunque el precio está cayendo, el impulso alcista podría estar ganando terreno, lo que podría conducir a una reversión al alza. ✅ - Divergencia Bajista (Tendencia Bajista) 📉 :
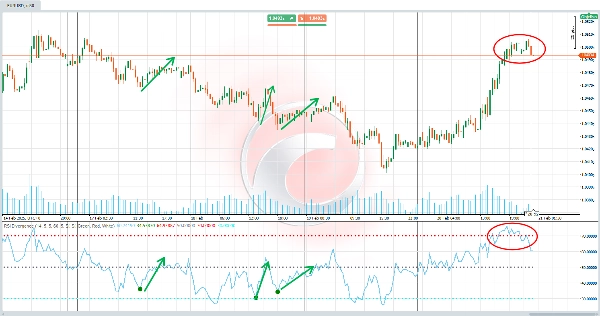
Ocurre cuando el precio forma máximos más altos , pero el RSI forma máximos más bajos . Esto sugiere que, aunque el precio está subiendo, el impulso bajista podría estar ganando terreno, lo que podría conducir a una reversión a la baja. ❌
El indicador detecta automáticamente estas divergencias y las resalta en el gráfico con colores, líneas y etiquetas para facilitar su interpretación. 🎯
💡 ¿Para Qué Se Usa?
Este indicador es especialmente útil para:
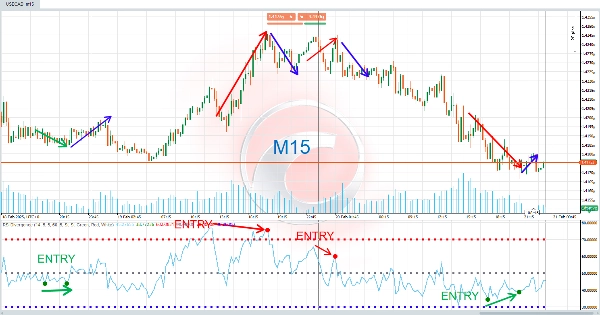
- Identificar puntos de entrada y salida : Las divergencias pueden actuar como señales de compra (alcistas) o venta (bajistas). 🛒💸
- Anticipar cambios de tendencia : Las divergencias son señales tempranas de que la tendencia actual podría estar perdiendo fuerza. ⚡
- Confirmar análisis técnico : Puede usarse junto con otros indicadores o patrones de velas para validar decisiones de trading. 🧠📊
Es ideal tanto para traders intradía como para inversores a largo plazo, ya que las divergencias aplican a cualquier marco temporal. ⏳📈
🛠️ ¿Cómo Usarlo?
- Configuración Inicial:
-
- Personaliza los parámetros según tus necesidades, como el período del RSI, los rangos de búsqueda de pivotes y los colores de las señales. 🎨⚙️
- Activa o desactiva la visualización de divergencias alcistas o bajistas según tus preferencias. ✅❌
- Interpretación de Señales:
-
- Divergencia Alcista : Cuando aparece una señal "D" verde en el gráfico, indica una posible oportunidad de compra. 🟩🛒
- Divergencia Bajista : Cuando aparece una señal "D" roja en el gráfico, indica una posible oportunidad de venta. 🟥🚫
- Además, se dibujan líneas que conectan los puntos de divergencia para facilitar el análisis visual. 📐🔗
- Toma de Decisiones:
-
- Utiliza estas señales para ajustar tus estrategias, como abrir posiciones, cerrar operaciones existentes o ajustar niveles de stop-loss. 🤝💼
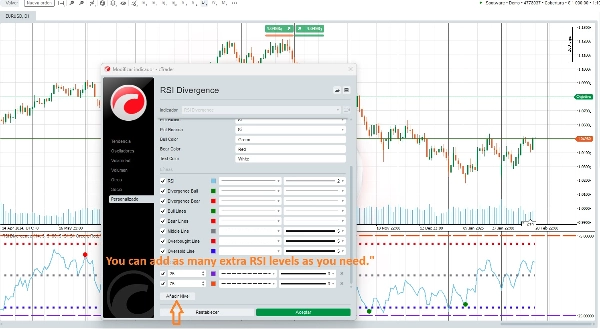
🆕 ¡Personalización Avanzada!
🌟 Puedes añadir tantos niveles de RSI como el usuario desee 🌟
Este indicador te permite personalizar completamente tu experiencia de trading. Puedes añadir múltiples niveles de RSI para adaptarlo a diferentes estrategias y estilos de trading. Por ejemplo, puedes configurar niveles adicionales de sobrecompra y sobreventa o incluso ajustar el período del RSI para adaptarlo a diferentes marcos temporales. 🔄📈📉
Resumen
Designed for use on any timeframe, the indicator helps traders identify entry and exit points, anticipate trend changes, and confirm other technical analysis signals. Users can customize parameters such as RSI period, pivot search ranges, signal colors, and enable or disable specific divergence types. Additionally, multiple RSI levels can be added to tailor the indicator to various trading strategies and styles.
This tool is suitable for intraday traders and long-term investors across markets including cryptocurrencies (e.g., BTCUSD), commodities (e.g., gold, XAUUSD), and indices. It supports enhanced decision-making by providing early warnings of trend strength shifts based on RSI divergence analysis.
Valoraciones de clientes
5 | 0 % | |
4 | 100 % | |
3 | 0 % | |
2 | 0 % | |
1 | 0 % |


