Descripción
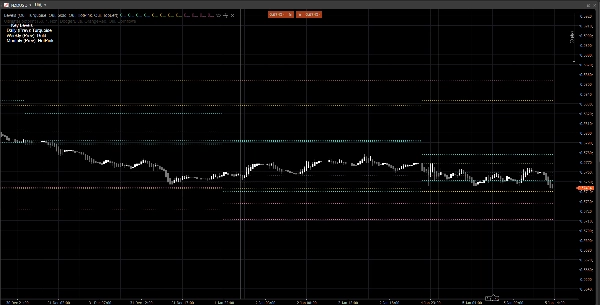
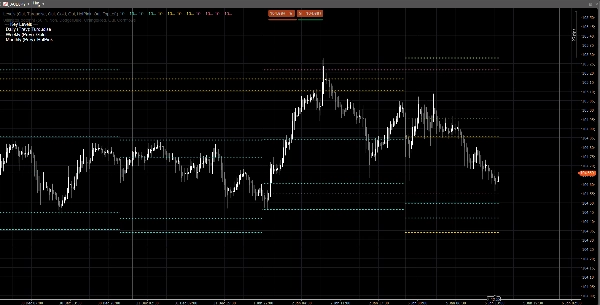
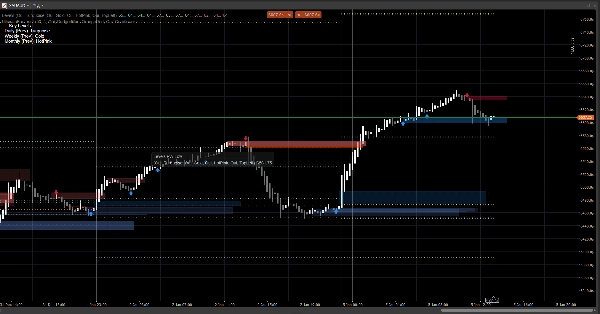
Zonas de Acción del Precio es un indicador ligero y sin ruido que traza los niveles clave diarios, semanales y mensuales previos directamente en tu gráfico.
Muestra:
- Día Anterior: Máximo / Mínimo / Apertura / Cierre
- Semana Anterior: Máximo / Mínimo / Apertura / Cierre
- Mes Anterior: Máximo / Mínimo / Apertura / Cierre
Estos niveles se usan ampliamente como zonas de reacción, referencias de liquidez y anclas de contexto para la estructura del mercado, entradas, objetivos y colocación de riesgo.
Por qué es útil
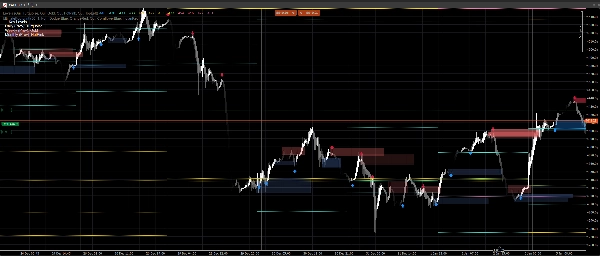
- Ver instantáneamente niveles de referencia de marcos temporales superiores sin cambiar de gráfico
- Ayuda a enmarcar la acción del precio intradía alrededor de PDH/PDL, PWH/PWL, PMH/PML
- Visual limpio: los niveles permanecen constantes durante la sesión/semana/mes actual
- Funciona en cualquier símbolo y marco temporal
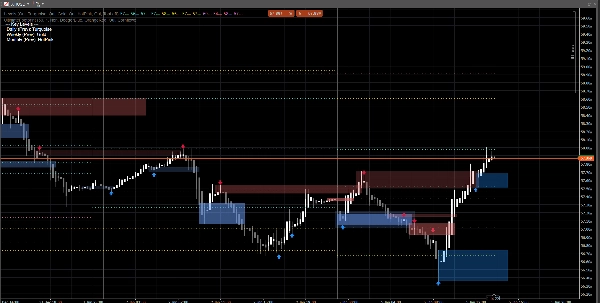
Personalización
Puedes activar o desactivar independientemente cada marco temporal:
- Mostrar Diario / Semanal / Mensual
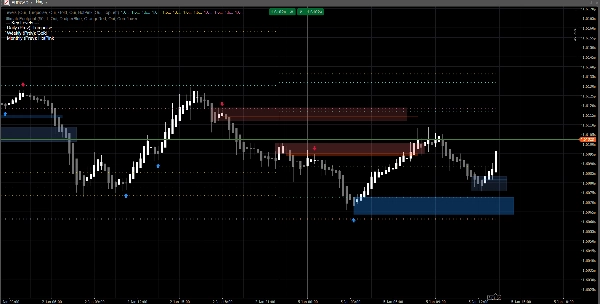
- Establecer un color personalizado para cada grupo
- Habilitar una leyenda simple, con posición seleccionable en la esquina
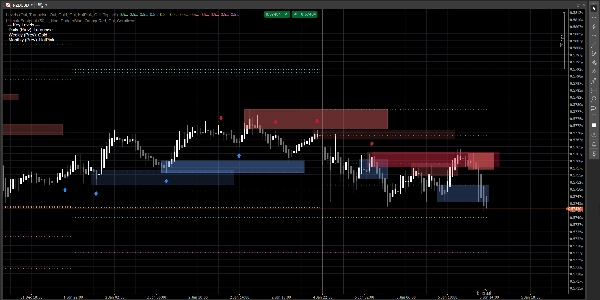
Notas técnicas
- Los niveles se calculan usando la vela diaria/semanal/mensual previa completada (no la que se está formando actualmente).
- Esto previene el repintado y mantiene los niveles estables durante la sesión.
Descargo de responsabilidad
Este indicador se proporciona solo para soporte de gráficos y toma de decisiones. No genera señales de compra/venta y no es asesoramiento financiero. Siempre gestiona el riesgo y valida con tus propios datos.
Las señales en el gráfico son generadas por el indicador Ultimate Footprint disponible en mi perfil.